In recent months, western investors have been willingly discussing attractiveness of Russian assets. The community divided: some fraction of analysts and investors seems to think that Russian assets' toxicity is fundamentally exaggerated. There is an opinion that even if the US and Europe keep restricting import of their capital and technology to Russia, the country's economy is capable of self-organization and import substitution. Taking into account a hypothetical oil recovery, there is a “great” opportunity to buy undervalued energy sector big caps. Long-term traders remind that the profit making entry to market is the most risky. After putting aside long-term risks evaluation (value at risk, VaR) let us try to understand if Russian technological sector has a chance to adapt.
Professional and technological crisis
The first tendency to remark is the growing divergence between the share of technological industries and labor productivity (see the figure below). The charts are drawn based on Statistical Bureau data and normalized to the reference level of 100% (2003 and 2005 years respectively). Notice the data since 2006 (marked with red): a clear deviation from regression corresponds to the global economic crisis of 2008-2009. However then the linear trend recovers.
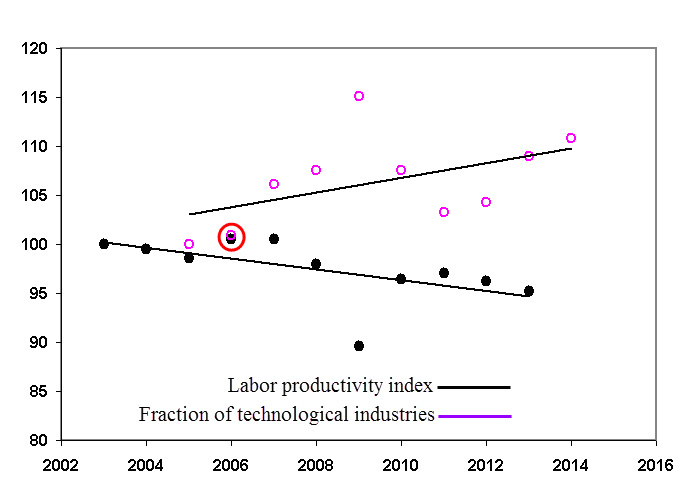
Notably, in 2008-2009 the share of technological industries increased. They potentially have a high value-added cost, thus, they are more resistant to poor market conditions. It is worth mentioning that science-based development was encouraged by Dmitri Medvedev policy. It was aimed at Russian industry modernization as a response to the global crisis. Modernization became inevitable, since soviet-made equipment was wearing out. The labor market index (volume of production in relation to wages and working hours) demonstrates negative dynamics. The paradoxical trend continues from 2004-2006 until present: production has been becoming less effective, while its technological and scientific base has been expanding.
In fact, this means that technologies and high-level specialists appeared to be overvalued and less efficient than expected, no matter if we are talking about deep drilling at transpolar rigs or gas liquefaction. High upgrade costs are also determined by the actual deficit of specialists. While the share of technological industries is rising, investments into education and science are decreasing. As a guide in such qualitative considerations, we would like to draw your attention to the chart, showing the number of university entrants at the beginning of academic year (Statistical Bureau).
The negative trend after 2006-2007 is caused by reduced funding and licensing regulations. The number of vocational students (in technical schools) dropped 20% from 2006 to mid-2015 that is 2% per year.
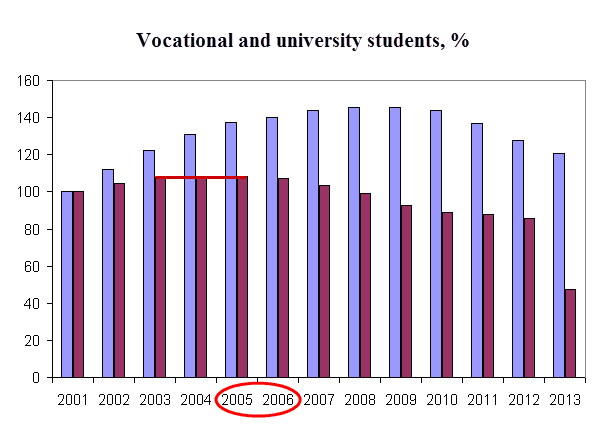
The trend firstly reverses in 2006-2007. Productivity slowdown, caused by staff shortages, commences at the same period. Lowering productivity and low demand of external markets resulted in dropping of GDP per capita. That is why from 2008 (the world financial crisis outbreak) to 2014 real disposable household income declined 4%. Lack of skilled personnel and necessary technologies leads at some point to substitution by lower-quality resources within a framework of modernization course.
Technological base of mining
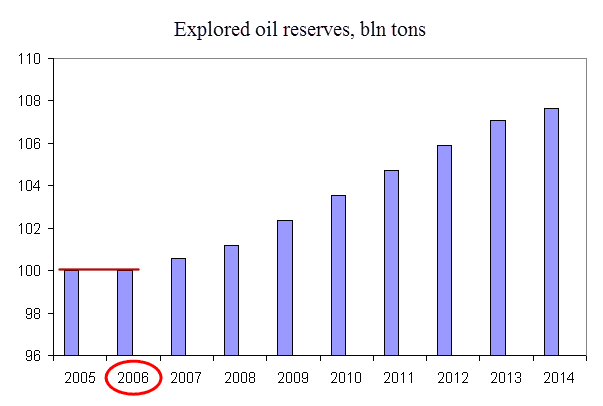
From 2000 to 2015 oil and gas revenues have grown from 9% to 50% (if we take the share in state budget), leaving Russian economy no alternative development paths during the world economic crisis. According to Gazprom (MCX:GAZP) analysts, the share of gas fields with complex mining conditions will exceed 60%. It is worth mentioning that the relative share of gas is not crucial – only 14% of energy products revenues. In 2000, light crude low-sulfur oil accounted for 83% of Russian oil balance, giving only 15% to heavy oils. By 2020, the shares of light and heavy oil are expected to become equal. That means advanced refining and exploitation of hard-to-reach fields in Arctic shelf. Accessible supplies depletion will raise geologic exploration costs and expenses on high technology drilling.
As distinct from retail, commodity sector imposes high requirements on technology and skilled personnel. This factor dramatically increases the negative effect of closed markets and technology import restrictions. Gas and oil sector giants, such as Gazprom, Surgutneftegaz (OTC:SGTPY) and Rosneft (LONDON:ROSNq), are unable to buy expensive technologies and hire specialists at home or abroad. The considered tendencies let us suppose that industrial and technological slowdown started 2 years before the global financial crisis of 2008 and 10 years before the Russian isolation of 2015. Adverse economic factors such as sanctions and the global crisis only accelerated the natural process.
Network retail development
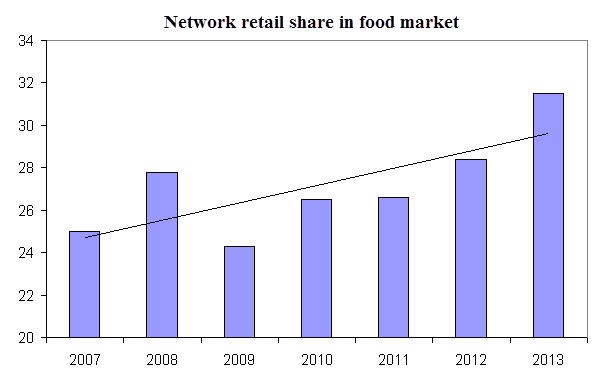
Geological exploration and export-dependent energy sectors were more dramatically affected by Russian professional and technological crisis than less demanding economy segments: network retail can be an example. In Russia the network retail began to develop before other retail trade segments. At the same time, it is dislocated – there are still many cities and communities with only one or two retail network stores available or without them at all. That means that logistics development and road construction may unleash network retail potential. Road construction program in 2010-2020 implies building about 1332 km of new highways and rebuilding about 900 km of existing roads. It is slightly more than expected before: according to the previous plan, they were going to build 1101 km of new routes and reconstruct 826 km of old-ones. The estimated overall cost will be equal to 1.57 trln rubles as compared to estimated 1.45 trln. Real personal income contraction results in the growing share of food products in expenditure. To be noted, the retail network share in food market has increased 30% since 2006, demonstrating a slight fall during the crisis.
While expanding geographically, retail networks actively seek domestic and foreign capitals. Recent data showed that in 2014 the Magnit network spent 40% of income to pay dividends; in 2015 it will spend for these purposes from 40% to 60%. The need for high-level technological and professional resources is pretty much determined by logistics and retail trade automation. That means that decline in vocational education had a weaker impact on retail sector than on metal and energy industries. Can this effect be useful when considering long-term investments in Russian economy?
Portfolio model
To put the discovered effect into practice let us consider four global depositary receipts for Russian stocks on the London Exchange list: Magnit (LONDON:MGNTq), Gazprom, Rosneft, Surgutneftegas. The current share prices and the dividend payments of 2014 are represented in the table below. We would like you to assess the attractiveness of the derivative, which is a depositary receipt for the base asset. All units are expressed in rubles.

The portfolio model of long/short positions implies buying Magnit depositary receipt and selling three receipts of the companies under sanctions: Gazprom, Rosneft and Surgutneftegas. The chart is plotted in the NetTradeX platform via the integrated GeWorko interface. The volumes of base and quoted parts of the portfolio are the same, resembling the buy and sell volumes of a currency cross-rate. To determine the shares to be included in the sell part of the portfolio we used the relative overbought P/D ratio – the current base asset price related to last year dividend payments. The receipt weights were selected in proportion to this ratio. The weights of short assets are distributed as follows: GAZP (32%), ROSN (45%), SNGS (23%). The quoted part overall weight equals 100%, shares are distributed automatically. Created via the GeWorko interface, the instrument can be added to the library for further operations and graph construction.
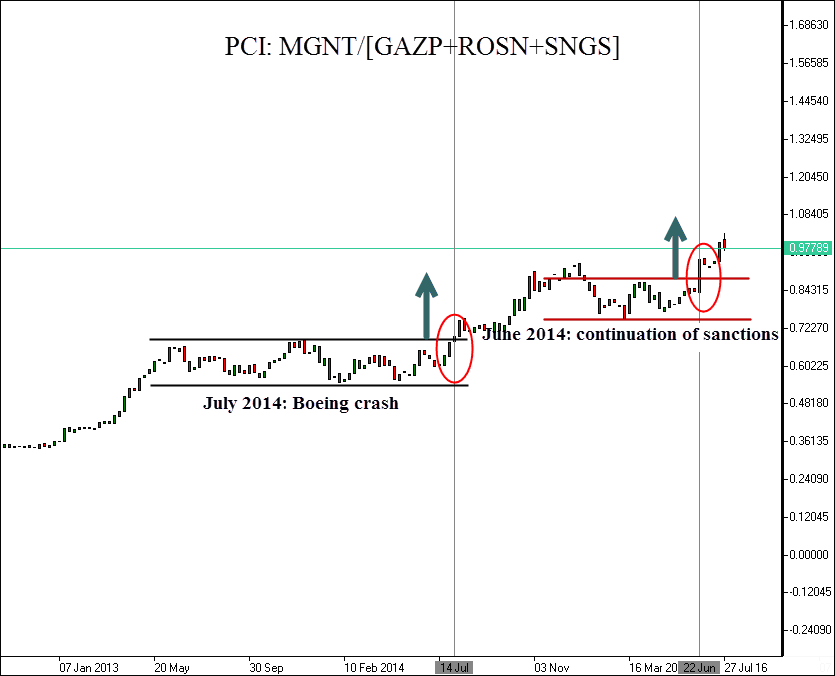
The chart is composed of weekly bars, corresponding to open and close prices. For two years, the portfolio has gained 309% (154% per year, excluding transaction fees). The maximum historical drawdown was 24% or 75% in relation to the starting price. Thus, at worst the portfolio recovery factor (the Calmar ratio) amounts to 4.12. Despite good performance, we recommend this portfolio as an analytical tool or as a hedging part of a more diversified portfolio, containing European or Russian assets. The main portfolio advantage is that it responds with growth to geopolitical tension between Russia and the European Union. As described above, Russian technological sector reacts more sharply to isolation despite consumer demand crisis in the country. Thus, the Boeing (NYSE:BA) crash in July 2014 served as a disturbing call for investors, implying long-term sanctions on Russian energy sector. We may now observe the next stage of portfolio growth. In July, EU leaders decided to extend sanctions for 6 months. Therefore, the portfolio spread represents a perfect tool for reducing risks, caused by increasing geopolitical distress between Russian and euro zone. The initial term of investment is one year; however, it can be revised in case of changing fundamental factors, such as:
- Complete or conditional lifting of sanctions;
- Sharp increase in spending on science and energy sector vocational education in Russia;
- Drastic reduction in geological exploration;
- Criminal proceedings against Magnit majority stockholders.
