By
Peter Mathers
of
Trading Lounge
Thursday, January 19, 2023 8:31 AM EDT
O'Reilly Automotive Inc., Elliott Wave Technical Analysis

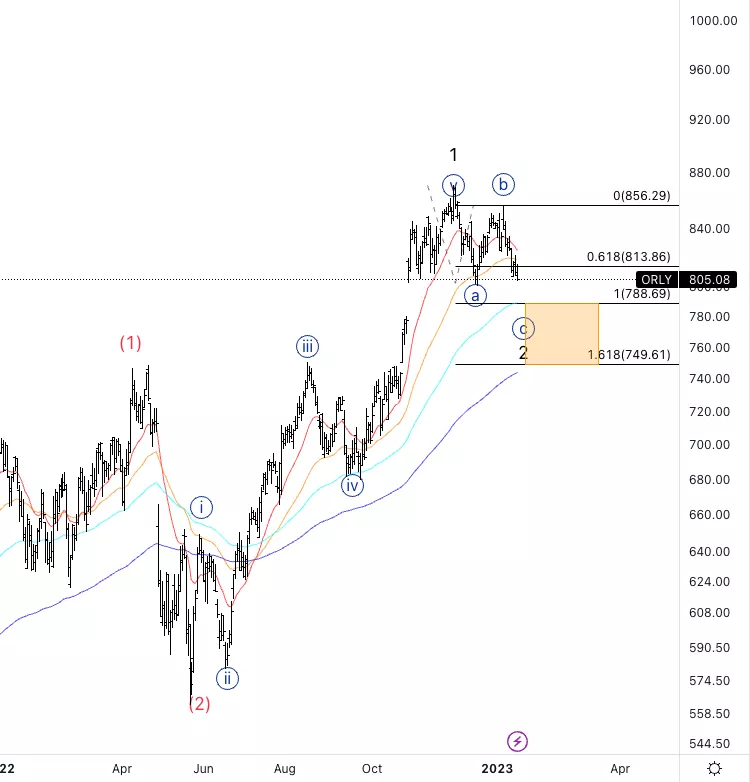
O'Reilly Automotive Inc., (ORLY): Daily Chart, January 19, 2023
ORLY Stock Market Analysis: Looking for a larger retracement into wave 2 to possibly take us back to fill the gap around 780$.
ORLY Elliott Wave Count: Wave {c} of 2.
ORLY Technical Indicators: In between averages.
ORLY Trading Strategy: Looking for the end of wave 2 to enter long.
TradingLounge Analyst: Alessio Barretta
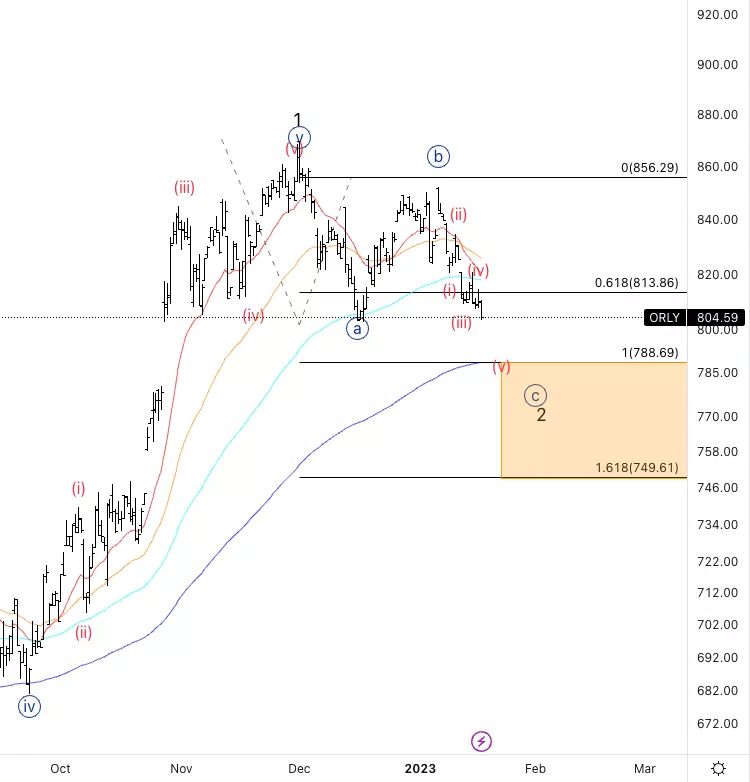
O'Reilly Automotive Inc., ORLY: 4-hour Chart, January 19, 2023
O'Reilly Automotive Inc., Elliott Wave Technical Analysis
ORLY Stock Market Analysis: Looking for downside into wave {c}, unfolding as expected. The count the way it is right now would only allow for a wave (v) shorter than (iii) therefore it’d mean having a short wave {c}. That means we could possibly be in wave (i) of {c} instead.
ORLY Elliott Wave count: Wave (v) of {c}.
ORLY Technical Indicators: Below all averages but the 200EMA.
ORLY Trading Strategy: Looking for downside to ends wave {c}.
More By This Author:
U.S. Stock Market Report - Elliott Wave Analysis
BNBUSD Elliott Wave Technical Analysis For Thursday, January 19
Elliott Wave Technical Analysis: Netflix - Jan. 18
Disclosure: As with any trading or investment opportunity there is a risk of making losses especially in day trading or investments that Trading Lounge expresses opinions on. Note: Historical ...
more
Disclosure: As with any trading or investment opportunity there is a risk of making losses especially in day trading or investments that Trading Lounge expresses opinions on. Note: Historical trading results are no guarantee of future returns. Some investments are inherently more risky than others. At worst, you could lose your entire investment and more TradingLounge™ uses a range of technical analysis tools, such as Elliott Wave, software and basic fundamental analysis as well as economic forecasts aimed at minimising the potential for loss. The advice we provide through our TradingLounge™ websites and our TradingLounge™ Membership has been prepared without taking into account your particular objectives, financial situation or needs. Reliance on such advice, information or data is at your own risk. The decision to trade and the method of trading is for you alone to decide, tradinglounge takes no responsibility whatsoever for your trading profits or losses. This information is of a general nature only, so you should, before acting upon any of the information or advice provided by us, consider the appropriateness of the advice in light of your own objectives, financial situation or needs. Therefore, you should consult your financial advisor or accountant to determine whether trading in Indices Stocks shares Forex CFDs Options Spread Betting derivatives of any kind / products is appropriate for you in light of your financial trading circumstances.
less
How did you like this article? Let us know so we can better customize your reading experience.


