
Metals Speculators Boosted Their Gold Bullish Bets Higher For 7th Week
Here are the latest charts and statistics for the Commitment of Traders (COT) data published by the Commodities Futures Trading Commission (CFTC).
The latest COT data is updated through Tuesday January 17th and shows a quick view of how large traders (for-profit speculators and commercial entities) were positioned in the futures markets.
Weekly Speculator Changes led by Copper & Gold
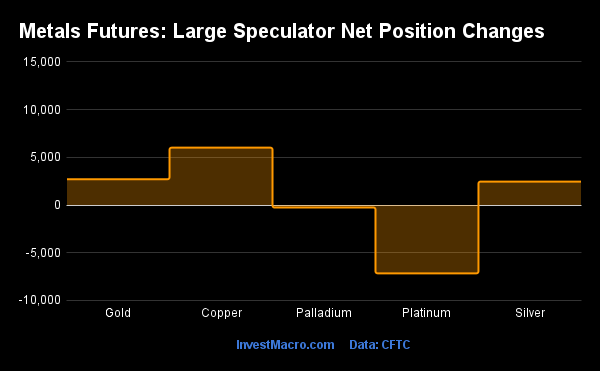
The COT metals markets speculator bets were higher this week as three out of the five precious metals markets we cover had higher positioning while the other two markets had lower speculator contracts.
The markets with declines in speculator bets for the week were Platinum (-7,158 contracts) and Palladium (-261 contracts) also registering lower bets on the week.
Highlighting the COT metals data this week is the recent streak of gains for the Gold speculative positions. The large speculator position in Gold futures rose this week for a seventh consecutive week and for the ninth time out of the past eleven weeks. The Gold position has now gone from a multi-year low total of +64,623 contracts on November 1st to a total of +153,240 contracts this week which marks the highest weekly total of the past 29 weeks, dating back to June 28th.
The Gold futures price has been on the move higher since seeing a recent bottom in October around the $1,620.00 level. This week, the Gold futures closed at $1,928.20 per ounce which is the highest close since April and Gold is showing an approximate gain by 18 percent since the October bottom.
|
Jan-17-2023
|
OI
|
OI-Index
|
Spec-Net
|
Spec-Index
|
Com-Net
|
COM-Index
|
Smalls-Net
|
Smalls-Index
|
|---|---|---|---|---|---|---|---|---|
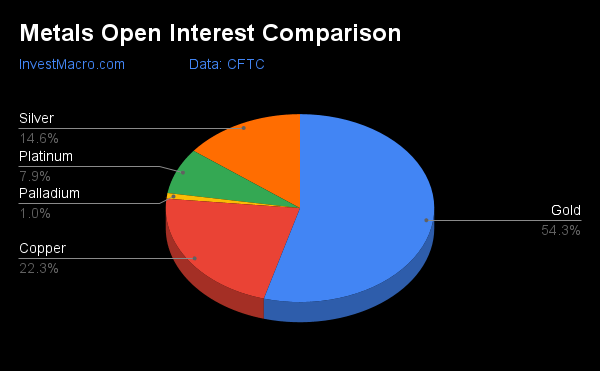
| Gold | 491,818 | 22 | 153,240 | 34 | -175,913 | 65 | 22,673 | 37 |
| Copper | 201,455 | 42 | 16,238 | 49 | -22,695 | 49 | 6,457 | 63 |
| Silver | 131,862 | 9 | 31,468 | 49 | -45,367 | 52 | 13,899 | 40 |
| Platinum | 71,144 | 41 | 23,544 | 41 | -28,913 | 59 | 5,369 | 40 |
| Palladium | 8,799 | 16 | -2,751 | 12 | 2,902 | 86 | -151 | 33 |
Strength Scores led by Silver & Copper
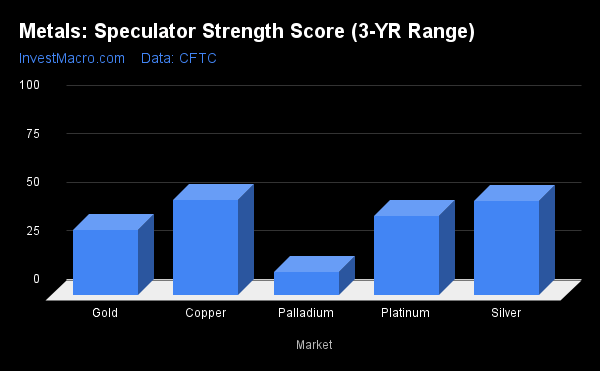
COT Strength Scores (a normalized measure of Speculator positions over a 3-Year range, from 0 to 100 where above 80 is Extreme-Bullish and below 20 is Extreme-Bearish) showed that Silver (49 percent) and Copper (49 percent) lead the metals markets this week.
On the downside, Palladium (12 percent) comes in at the lowest strength level currently and is in Extreme-Bearish territory (below 20 percent). The next lowest strength score was Gold (34 percent).
Strength Statistics:
Gold (33.5 percent) vs Gold previous week (32.6 percent)
Silver (48.8 percent) vs Silver previous week (46.1 percent)
Copper (49.2 percent) vs Copper previous week (44.5 percent)
Platinum (40.7 percent) vs Platinum previous week (50.4 percent)
Palladium (11.9 percent) vs Palladium previous week (14.3 percent)
Silver & Gold top the 6-Week Strength Trends

COT Strength Score Trends (or move index, calculates the 6-week changes in strength scores) showed that Silver (14 percent) leads the past six weeks trends for metals. Gold (13 percent) is the next highest positive mover in the latest trends data.
Palladium (-13 percent) leads the downside trend scores currently with Platinum (-3 percent) as the next market with lower trend scores.
Move Statistics:
Gold (12.6 percent) vs Gold previous week (13.4 percent)
Silver (13.5 percent) vs Silver previous week (12.7 percent)
Copper (11.6 percent) vs Copper previous week (6.6 percent)
Platinum (-2.8 percent) vs Platinum previous week (8.7 percent)
Palladium (-12.6 percent) vs Palladium previous week (-7.8 percent)
Individual Markets:
Gold Comex Futures:
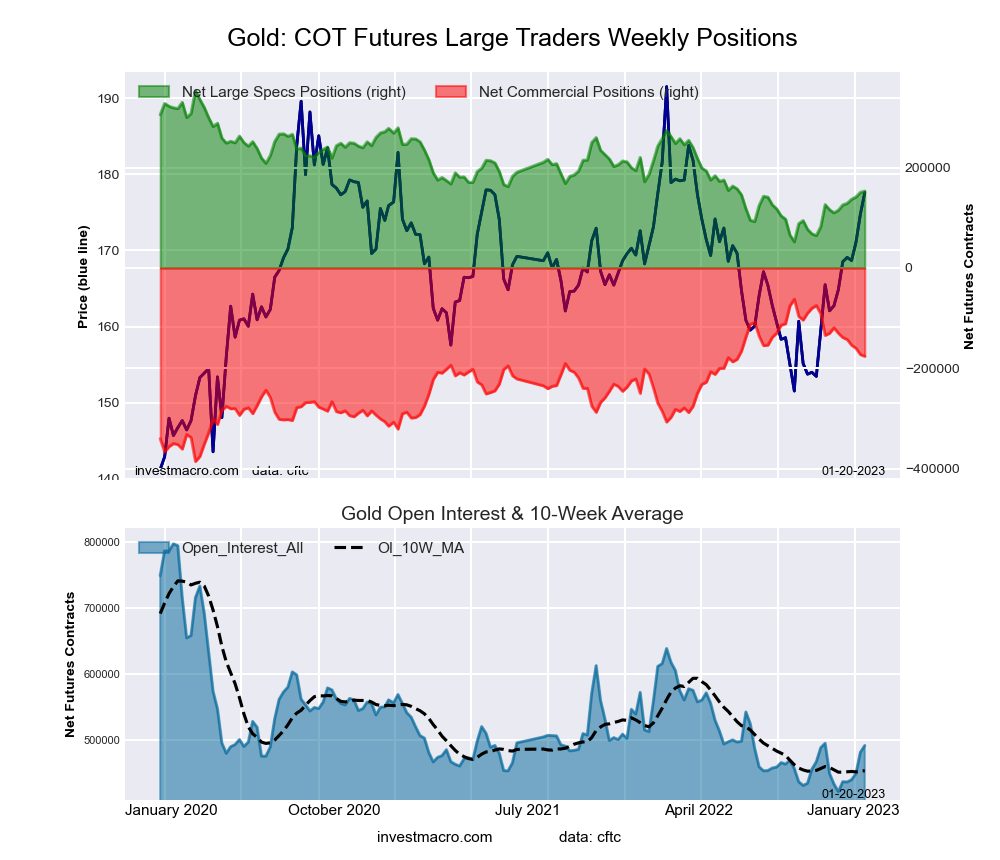
The Gold Comex Futures large speculator standing this week reached a net position of 153,240 contracts in the data reported through Tuesday. This was a weekly lift of 2,705 contracts from the previous week which had a total of 150,535 net contracts.
This week’s current strength score (the trader positioning range over the past three years, measured from 0 to 100) shows the speculators are currently Bearish with a score of 33.5 percent. The commercials are Bullish with a score of 64.8 percent and the small traders (not shown in chart) are Bearish with a score of 36.8 percent.
| Gold Futures Statistics | SPECULATORS | COMMERCIALS | SMALL TRADERS |
| – Percent of Open Interest Longs: | 50.2 | 25.0 | 9.8 |
| – Percent of Open Interest Shorts: | 19.0 | 60.7 | 5.2 |
| – Net Position: | 153,240 | -175,913 | 22,673 |
| – Gross Longs: | 246,874 | 122,814 | 48,128 |
| – Gross Shorts: | 93,634 | 298,727 | 25,455 |
| – Long to Short Ratio: | 2.6 to 1 | 0.4 to 1 | 1.9 to 1 |
| NET POSITION TREND: | |||
| – Strength Index Score (3 Year Range Pct): | 33.5 | 64.8 | 36.8 |
| – Strength Index Reading (3 Year Range): | Bearish | Bullish | Bearish |
| NET POSITION MOVEMENT INDEX: | |||
| – 6-Week Change in Strength Index: | 12.6 | -14.2 | 19.4 |
Silver Comex Futures:
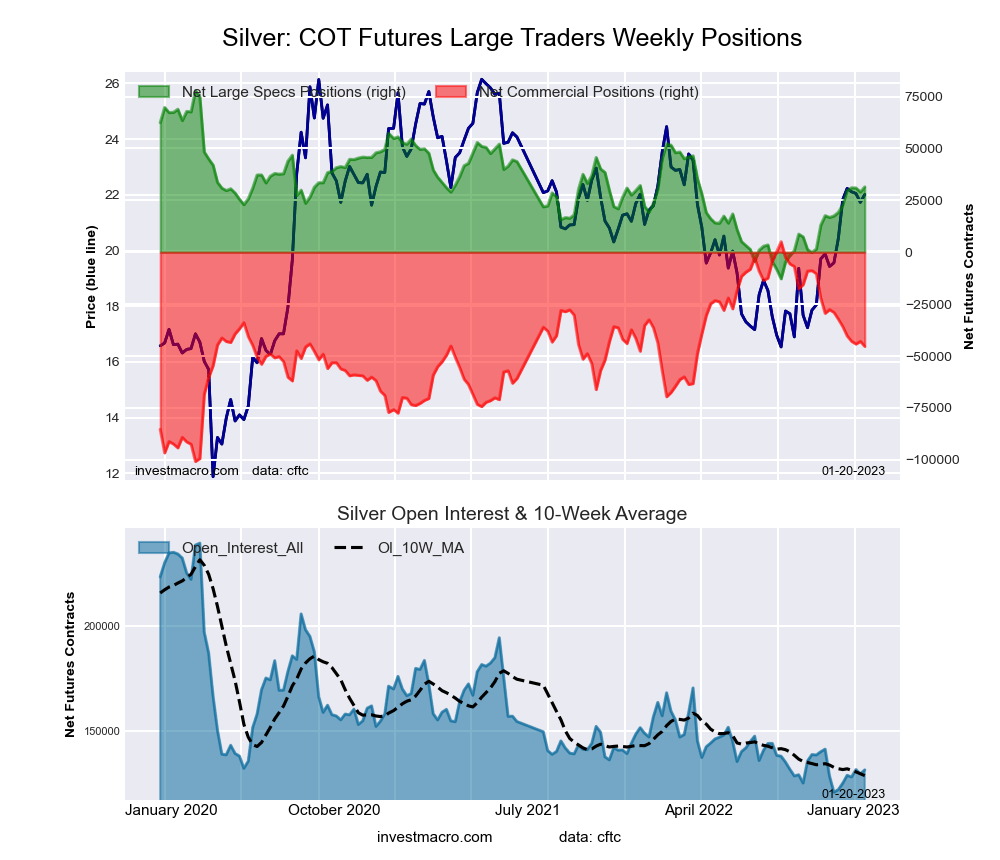
The Silver Comex Futures large speculator standing this week reached a net position of 31,468 contracts in the data reported through Tuesday. This was a weekly lift of 2,455 contracts from the previous week which had a total of 29,013 net contracts.
This week’s current strength score (the trader positioning range over the past three years, measured from 0 to 100) shows the speculators are currently Bearish with a score of 48.8 percent. The commercials are Bullish with a score of 52.4 percent and the small traders (not shown in chart) are Bearish with a score of 39.7 percent.
| Silver Futures Statistics | SPECULATORS | COMMERCIALS | SMALL TRADERS |
| – Percent of Open Interest Longs: | 43.6 | 32.4 | 18.2 |
| – Percent of Open Interest Shorts: | 19.7 | 66.8 | 7.6 |
| – Net Position: | 31,468 | -45,367 | 13,899 |
| – Gross Longs: | 57,439 | 42,668 | 23,983 |
| – Gross Shorts: | 25,971 | 88,035 | 10,084 |
| – Long to Short Ratio: | 2.2 to 1 | 0.5 to 1 | 2.4 to 1 |
| NET POSITION TREND: | |||
| – Strength Index Score (3 Year Range Pct): | 48.8 | 52.4 | 39.7 |
| – Strength Index Reading (3 Year Range): | Bearish | Bullish | Bearish |
| NET POSITION MOVEMENT INDEX: | |||
| – 6-Week Change in Strength Index: | 13.5 | -12.4 | 4.3 |
Copper Grade #1 Futures:
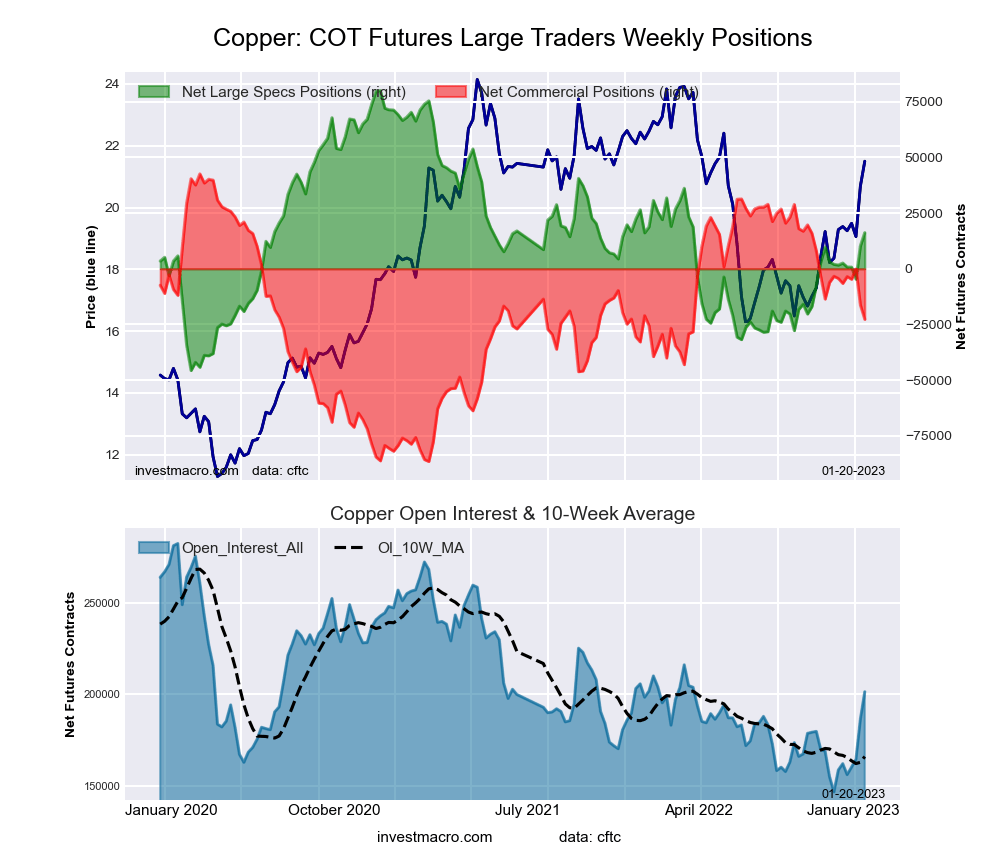
The Copper Grade #1 Futures large speculator standing this week reached a net position of 16,238 contracts in the data reported through Tuesday. This was a weekly rise of 6,011 contracts from the previous week which had a total of 10,227 net contracts.
This week’s current strength score (the trader positioning range over the past three years, measured from 0 to 100) shows the speculators are currently Bearish with a score of 49.2 percent. The commercials are Bearish with a score of 49.4 percent and the small traders (not shown in chart) are Bullish with a score of 62.6 percent.
| Copper Futures Statistics | SPECULATORS | COMMERCIALS | SMALL TRADERS |
| – Percent of Open Interest Longs: | 42.1 | 34.7 | 9.9 |
| – Percent of Open Interest Shorts: | 34.1 | 46.0 | 6.7 |
| – Net Position: | 16,238 | -22,695 | 6,457 |
| – Gross Longs: | 84,910 | 69,997 | 19,961 |
| – Gross Shorts: | 68,672 | 92,692 | 13,504 |
| – Long to Short Ratio: | 1.2 to 1 | 0.8 to 1 | 1.5 to 1 |
| NET POSITION TREND: | |||
| – Strength Index Score (3 Year Range Pct): | 49.2 | 49.4 | 62.6 |
| – Strength Index Reading (3 Year Range): | Bearish | Bearish | Bullish |
| NET POSITION MOVEMENT INDEX: | |||
| – 6-Week Change in Strength Index: | 11.6 | -14.2 | 21.9 |
Platinum Futures:
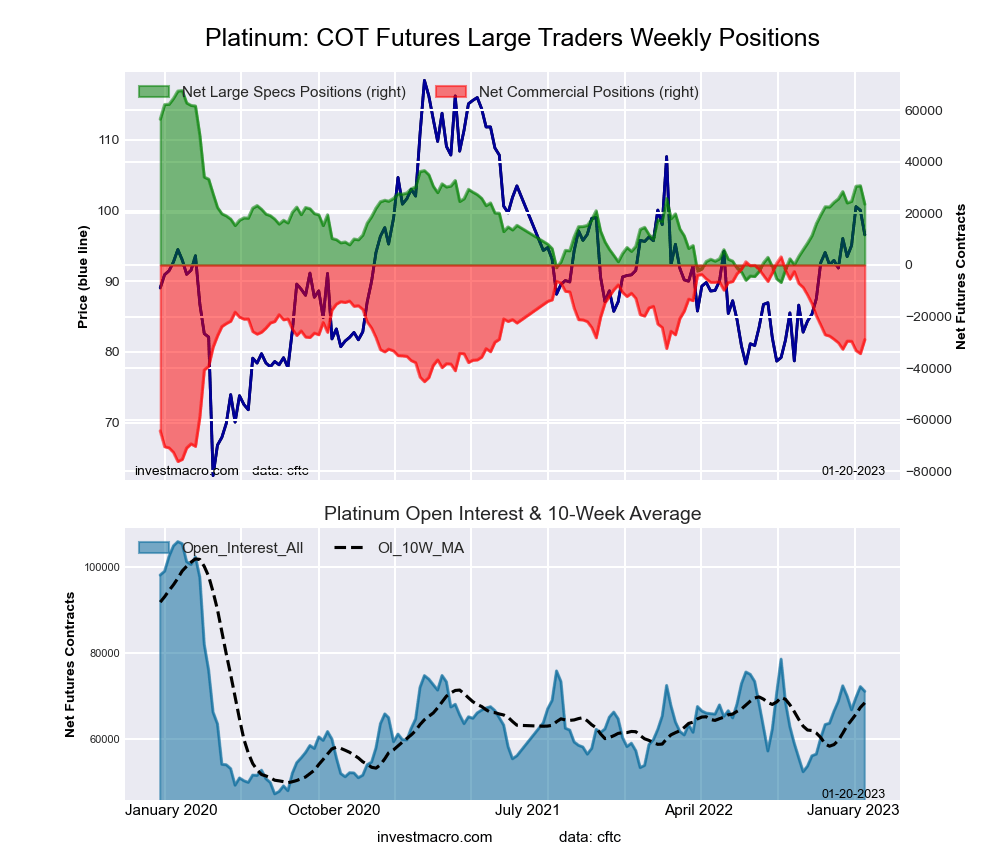
The Platinum Futures large speculator standing this week reached a net position of 23,544 contracts in the data reported through Tuesday. This was a weekly reduction of -7,158 contracts from the previous week which had a total of 30,702 net contracts.
This week’s current strength score (the trader positioning range over the past three years, measured from 0 to 100) shows the speculators are currently Bearish with a score of 40.7 percent. The commercials are Bullish with a score of 59.1 percent and the small traders (not shown in chart) are Bearish with a score of 40.0 percent.
| Platinum Futures Statistics | SPECULATORS | COMMERCIALS | SMALL TRADERS |
| – Percent of Open Interest Longs: | 56.8 | 27.9 | 11.5 |
| – Percent of Open Interest Shorts: | 23.7 | 68.5 | 3.9 |
| – Net Position: | 23,544 | -28,913 | 5,369 |
| – Gross Longs: | 40,387 | 19,831 | 8,162 |
| – Gross Shorts: | 16,843 | 48,744 | 2,793 |
| – Long to Short Ratio: | 2.4 to 1 | 0.4 to 1 | 2.9 to 1 |
| NET POSITION TREND: | |||
| – Strength Index Score (3 Year Range Pct): | 40.7 | 59.1 | 40.0 |
| – Strength Index Reading (3 Year Range): | Bearish | Bullish | Bearish |
| NET POSITION MOVEMENT INDEX: | |||
| – 6-Week Change in Strength Index: | -2.8 | 1.6 | 11.4 |
Palladium Futures:
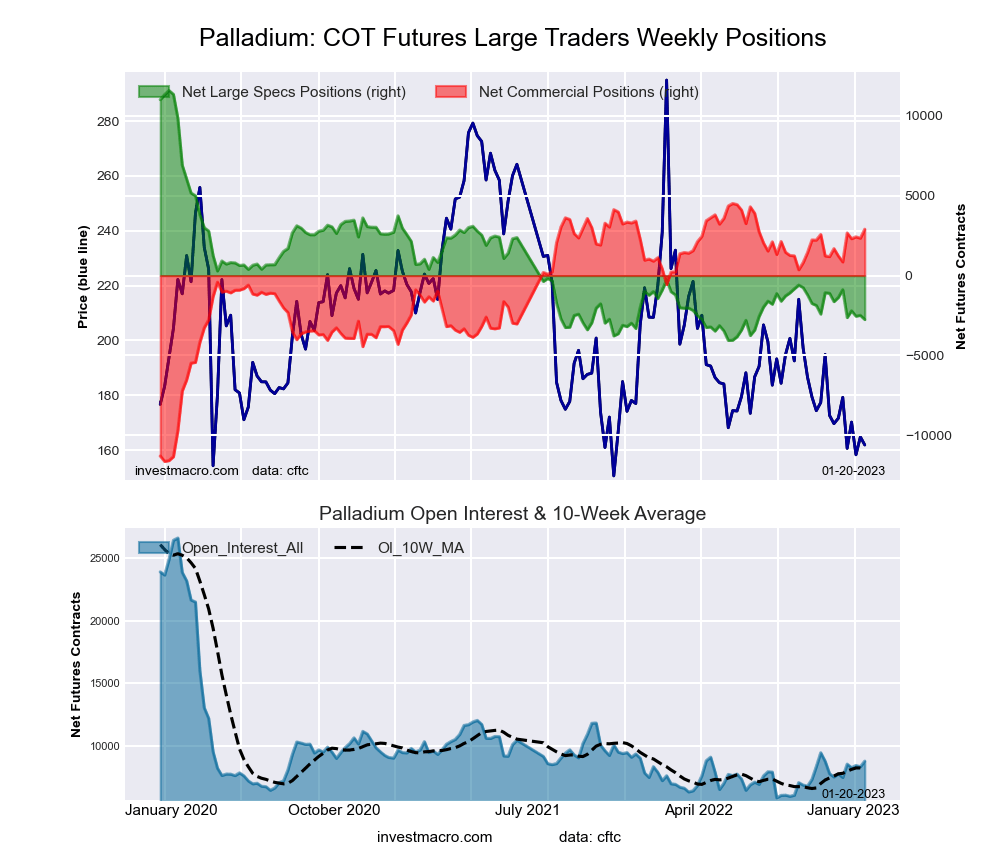
The Palladium Futures large speculator standing this week reached a net position of -2,751 contracts in the data reported through Tuesday. This was a weekly reduction of -261 contracts from the previous week which had a total of -2,490 net contracts.
This week’s current strength score (the trader positioning range over the past three years, measured from 0 to 100) shows the speculators are currently Bearish-Extreme with a score of 11.9 percent. The commercials are Bullish-Extreme with a score of 86.3 percent and the small traders (not shown in chart) are Bearish with a score of 32.6 percent.
| Palladium Futures Statistics | SPECULATORS | COMMERCIALS | SMALL TRADERS |
| – Percent of Open Interest Longs: | 24.2 | 57.1 | 14.6 |
| – Percent of Open Interest Shorts: | 55.4 | 24.1 | 16.3 |
| – Net Position: | -2,751 | 2,902 | -151 |
| – Gross Longs: | 2,125 | 5,025 | 1,285 |
| – Gross Shorts: | 4,876 | 2,123 | 1,436 |
| – Long to Short Ratio: | 0.4 to 1 | 2.4 to 1 | 0.9 to 1 |
| NET POSITION TREND: | |||
| – Strength Index Score (3 Year Range Pct): | 11.9 | 86.3 | 32.6 |
| – Strength Index Reading (3 Year Range): | Bearish-Extreme | Bullish-Extreme | Bearish |
| NET POSITION MOVEMENT INDEX: | |||
| – 6-Week Change in Strength Index: | -12.6 | 14.3 | -17.8 |
*COT Report: The COT data, released weekly to the public each Friday, is updated through the most recent Tuesday (data is 3 days old) and shows a quick view of how large speculators or non-commercials (for-profit traders) were positioned in the futures markets.
The CFTC categorizes trader positions according to commercial hedgers (traders who use futures contracts for hedging as part of the business), non-commercials (large traders who speculate to realize trading profits) and nonreportable traders (usually small traders/speculators) as well as their open interest (contracts open in the market at time of reporting). See CFTC criteria here.
More By This Author:
Currency Speculators Pull Back On Japanese Yen Bearish Bets To 21-Week Low
Live Cattle Leads Soft Commodities Speculator Bets While Corn & Sugar Bets Fall
COT Bonds Speculators Reduced Their 2-Year & 5-Year Bonds Bearish Bets This Week
Disclosure: Foreign Currency trading and trading on margin carries a high level of risk and can result in loss of part or all of your investment.Due to the level of risk and market volatility, ...
more

