Join Our Telegram channel to stay up to date on breaking news coverage
The Bitcoin price prediction shows that BTC remains at risk of more downsides before it could start a fresh increase to $25,000.
Bitcoin Prediction Statistics Data:
- Bitcoin price now – $23,143
- Bitcoin market cap – $444.9 billion
- Bitcoin circulating supply – 19.2 million
- Bitcoin total supply – 19.2 million
- Bitcoin Coinmarketcap ranking – #1
BTC/USD Long-term Trend: Ranging (Daily Chart)
Key levels:
Resistance Levels: $27,000, $28,000, $29,000
Support Levels: $20,000, $19,000, $18,000
BTC/USD begins to decline as the king coin moves near the support level of $23,000 and settled below the 9-day and 21-day moving averages. The bears may continue to find some support levels below moving averages on the road to the lower boundary of the channel.
Bitcoin Price Prediction: BTC Price Resumes Downward Movement
The Bitcoin price touches the daily low at $23,012, which is below the opening price of $23,329. The king coin is likely to face the resistance level of $25,000 by looking forward to reclaiming the resistance level of $24,000. Besides, there was a break below a major bullish trend line with support near $23,500 on the daily chart of the BTC/USD pair. Nevertheless, the Bitcoin price is still hovering above $23,000 and within the 9-day and 21-day moving averages.
Meanwhile, the technical indicator Relative Strength Index (14) is moving below the 70-level, indicating a bearish movement. Therefore, if the Bitcoin price faces the upper boundary of the channel, it could hit the resistance levels of $27,000, $28,000, and $29,000, but any movement below the 21-day moving average could hit the supports at $20,000, $19,000, and $18,000.
BTC/USD Medium-term Trend: Ranging (4H Chart)
According to the 4-hour chart, the Bitcoin price heads to the downside as the technical indicator Relative Strength Index (14) slides below the 40-level. On the upside, if the Bitcoin price crosses above the 9-day and 21-day moving averages in the short term, bullish influence could spike, and the accrued gains massively.
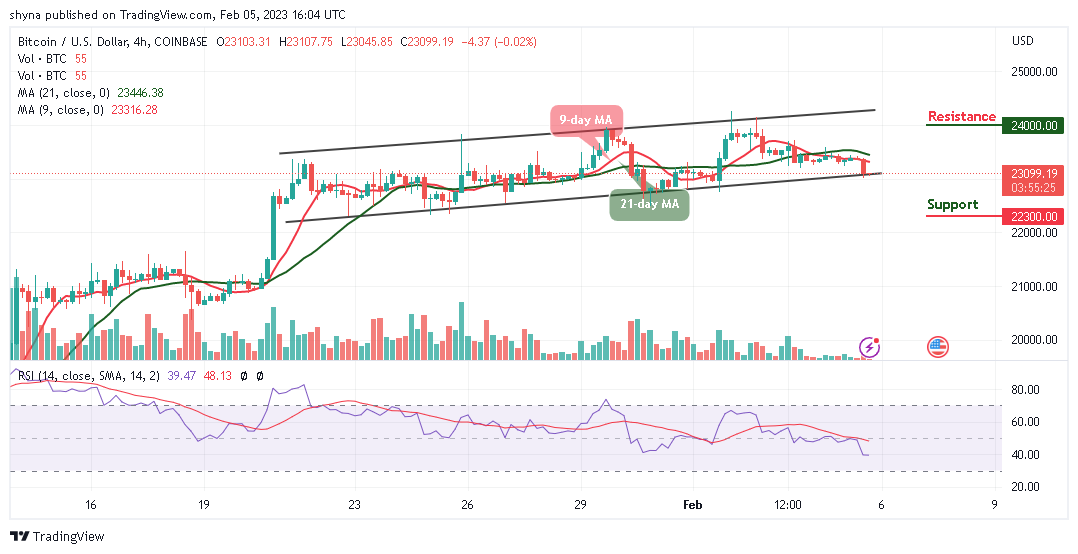
However, the current candle may target the support level at $22,300 and below, but the best the bulls can do is to hold the current market value of $23,099 and keep their attention on breaking the potential resistance at $24,000 and above.
Bitcoin Alternatives
The Bitcoin price could attempt a fresh increase above the $24,000 resistance zone and a clear move above this level might send the price further higher. Meanwhile, the MEMAG token is moving fast as over $2.7 million has been raised in presale so far. The crypto world is buzzing with excitement over the new crypto gaming project, which is developing Web3’s first dedicated mobile gaming platform.
Join Our Telegram channel to stay up to date on breaking news coverage