
A Relative Strength Index (RSI) is a momentum indicator that shows whether a security is overbought or oversold. RSI is a technical indicator that works by measuring the speed and volume of the price movement of a stock.
RSI is a type of momentum oscillator, a tool that fluctuates between a set of two extreme levels/bands of a security. The RSI is plotted as a line graph and is often plotted below the price graph of a stock.
As suggested by J Welles Wilder, the developer of this indicator, the RSI is measured on a scale of zero to 100. Theoretically, an RSI of 70 or more indicates that the stock is overbought, meaning there are more buyers for the stock than sellers. That is the simple reason for the rapid increase in the stock price and volume of the security at a given time. This is also perceived as a sign of a selling opportunity, as the price of the stock may reverse (price correction) after this point.
On the other hand, an RSI of 30 or less indicates that the stock is oversold, meaning there are more sellers for the stock than buyers, leading to a rapid decline in the stock’s price. Further, an RSI going below 30 is perceived as a sign of a buying opportunity and an expected price uptrend going forward.
For calculation purposes, a 14-day RSI is most popularly used to study a stock’s price movement. You may also choose a different period if you wish. However, commonly, if a stock rises for all 14 consecutive days, the RSI will be 100. If the stock falls for 14 days, the RSI will be 0.
As is widely understood, overbought means the stock is trading at a premium and therefore could be sold, while oversold means the stock is trading cheaply and therefore could be bought. Having said that, it is advisable to use the RSI indicator along with other technical indicators to make appropriate buy or sell decisions.
An RSI reading for a particular stock can also be adjusted under certain circumstances. Assuming a stock is frequently trading above the overbought level of 70, you may change the RSI level to 80 to get a better view.
It is important to note that RSI may remain in overbought or oversold territory for a prolonged period during times of strong trends. For instance, during downtrends (bear market), an overbought reading for RSI may be well below 70, while during uptrends (bull market), an oversold reading for RSI may be well above 30.
Working Example of RSI
Let’s see how the RSI indicator works with the live example of one of the most popular stocks, Meta Platforms (NASDAQ:META). On TipRanks, you can visit the Chart section for the stock and map the RSI below the price chart to study the momentum, as shown below.
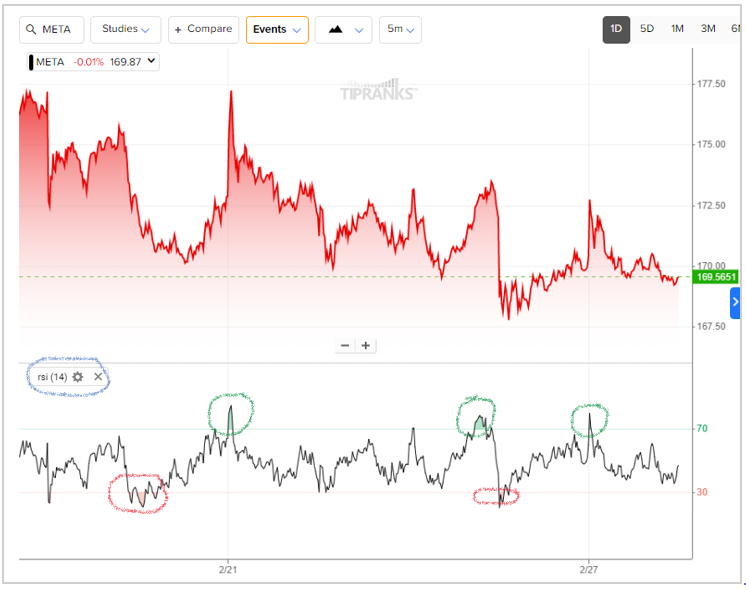
As seen from the chart above, the RSI for META moved into the overbought territories on February 21, 23, and 27 this year. Similarly, it moved into the oversold territories on February 27 and 24 recently.
You can change the default 14-day RSI range, as well as the overbought and oversold lines, from 70 and 30. This can be done by clicking on the Settings icon next to the “rsi (14)” icon on the chart. You can easily change the day range and the lines from this dropdown.
Key Takeaways
A relative strength index (RSI) can be one of the best gauges for technical trading. Notably, RSI is considered a leading indicator, since it gives early trade signals. Having said that, prolonged overbought or oversold signals can be misleading at times, and hence, investors must support their trading calls with other technical indicators.
To learn more about the different technical indicators, visit TipRanks’ newly launched Technical Analysis tool. Now, go ahead and try the tools on TipRanks’ unique platform and smoothen your trades.
