Published
1 year ago on
March 28, 2023

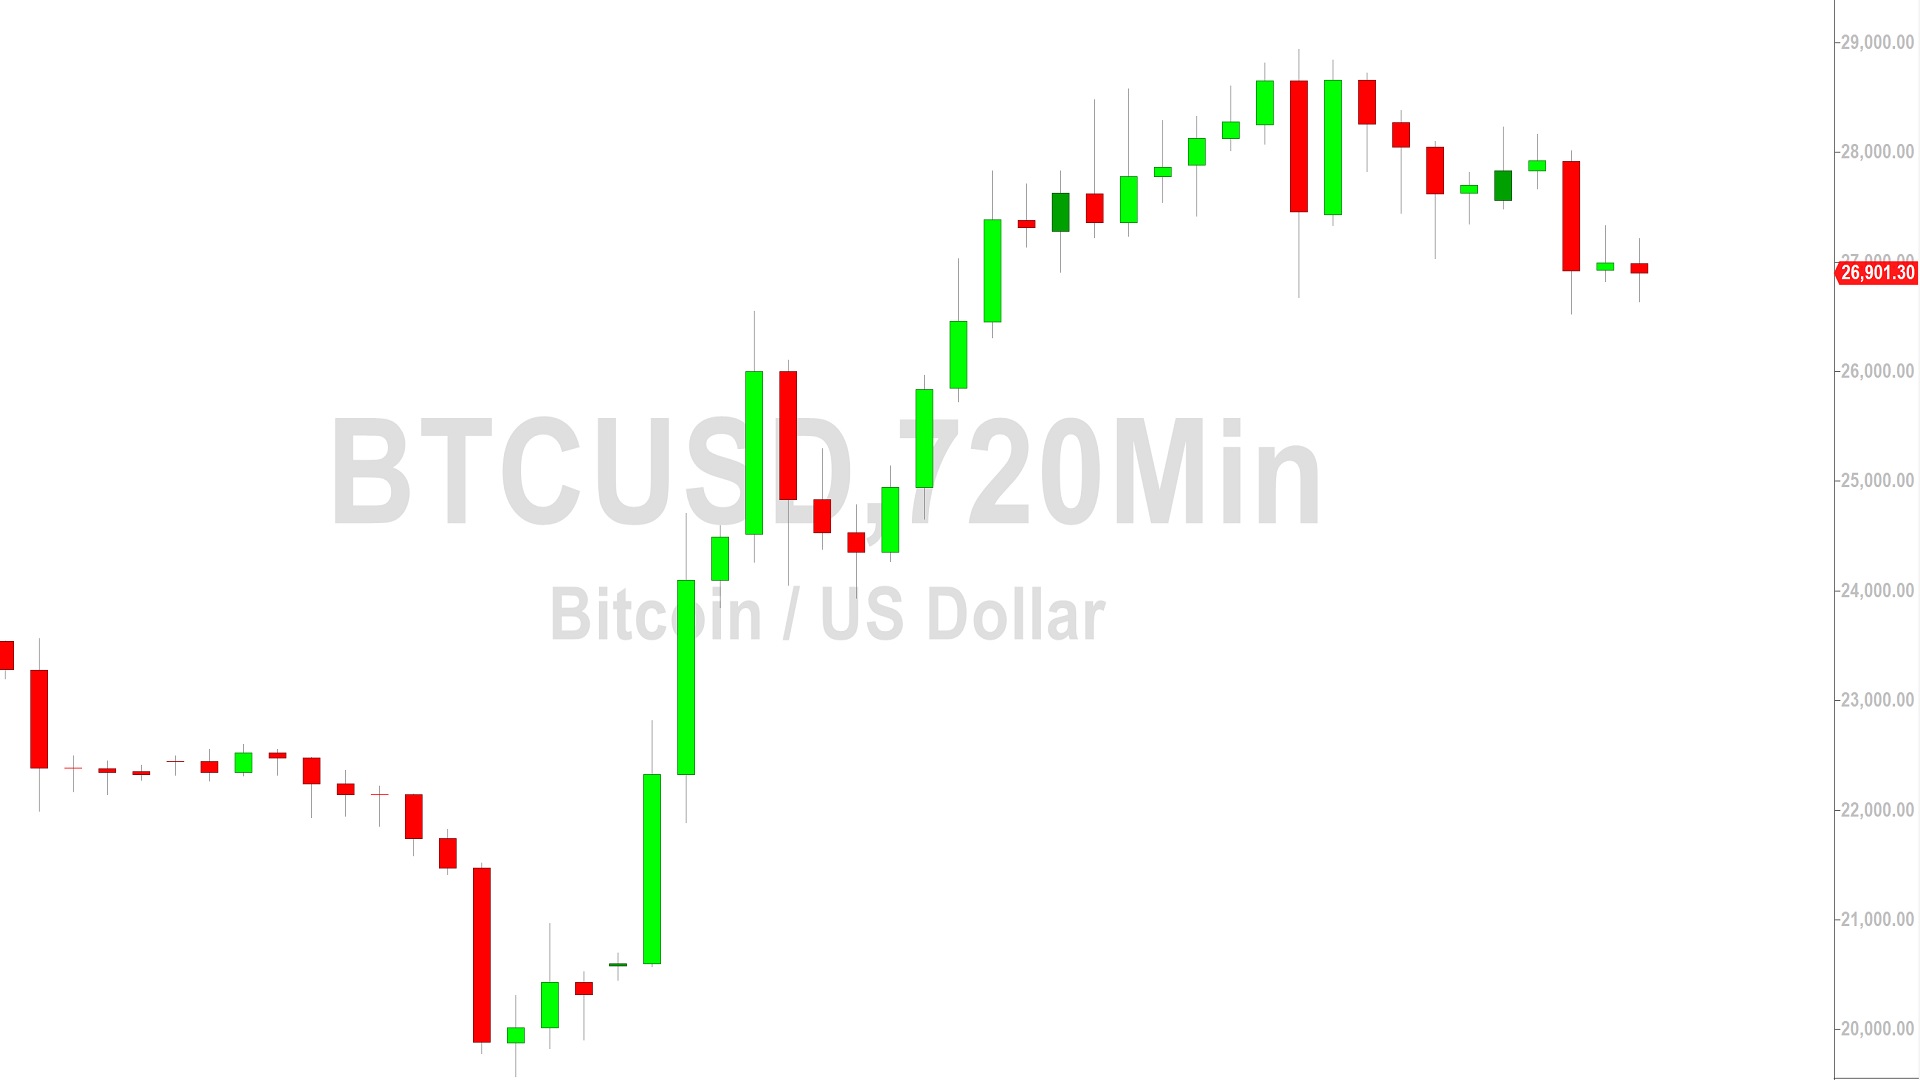
BTC/USD Bears Eyeing 26139: Sally Ho’s Technical Analysis – 29 March 2023
Bitcoin (BTC/USD) awaited fresh technical guidance early in the Asian session as the pair traded around the 27000 figure after trading as low as the 26640 area before once again testing the 27182 area, a downside price objective associated with selling pressure around the 28555 level. If recent selling pressure continues and the recent low of 26525 is absorbed, BTC/USD may test additional downside price objectives including the 26139, 25478, 24661, and 23340 levels. During the ongoing pullback, Stops were elected below the 27252.39 area, a downside price objective related to selling pressure around the 28839.68 and 28500 levels. Technical trading activity was also evident when BTC/USD was recently supported around the 26678.16 level during the depreciation, a test of the 23.6% retracement of the recent appreciating range from 19568.52 to 28937.73.
Following the recent appreciation, upside price objectives include the 29244.66, 29639.37, 30127.80, 30275.12, 30763.09, and 31477.37 levels. Following the ongoing appreciation, retracement levels and areas of potential technical support include the 25948, 25756, 25358, 24253, 24099, 23789, 23147, 22605, and 22198 levels. Below current price activity, downside price objectives include the 19266, 19132, 19106, 19006, 18981, 18919, 18822, 18116, 17720, 17523, 17457, 17230, and 17196 areas. Traders are observing that the 50-bar MA (4-hourly) is bullishly indicating above the 100-bar MA (4-hourly) and above the 200-bar MA (4-hourly). Also, the 50-bar MA (hourly) is bearishly indicating below the 100-bar MA (hourly) and below the 200-bar MA (hourly).
Price activity is nearest the 100-bar MA (4-hourly) at 26015.26 and the 50-bar MA (Hourly) at 27466.73.
Technical Support is expected around 25256.83/ 24224.60/ 21753.70 with Stops expected below.
Technical Resistance is expected around 29244.66/ 29639.37/ 30127.80 with Stops expected above.
On 4-Hourly chart, SlowK is Bearishly below SlowD while MACD is Bearishly below MACDAverage.
On 60-minute chart, SlowK is Bullishly above SlowD while MACD is Bullishly above MACDAverage.
Disclaimer: Sally Ho’s Technical Analysis is provided by a third party, and for informational purposes only. It does not reflect the views of Crypto Daily, nor is it intended to be used as legal, tax, investment, or financial advice.
Investment Disclaimer
Halving Hype: Runes Protocol Poised to Reshape Bitcoin's Token Economy
Bitcoin is finished? Think again