Published
1 year ago on
March 29, 2023
BTC/USD Bulls Eyeing 30127: Sally Ho’s Technical Analysis – 30 March 2023
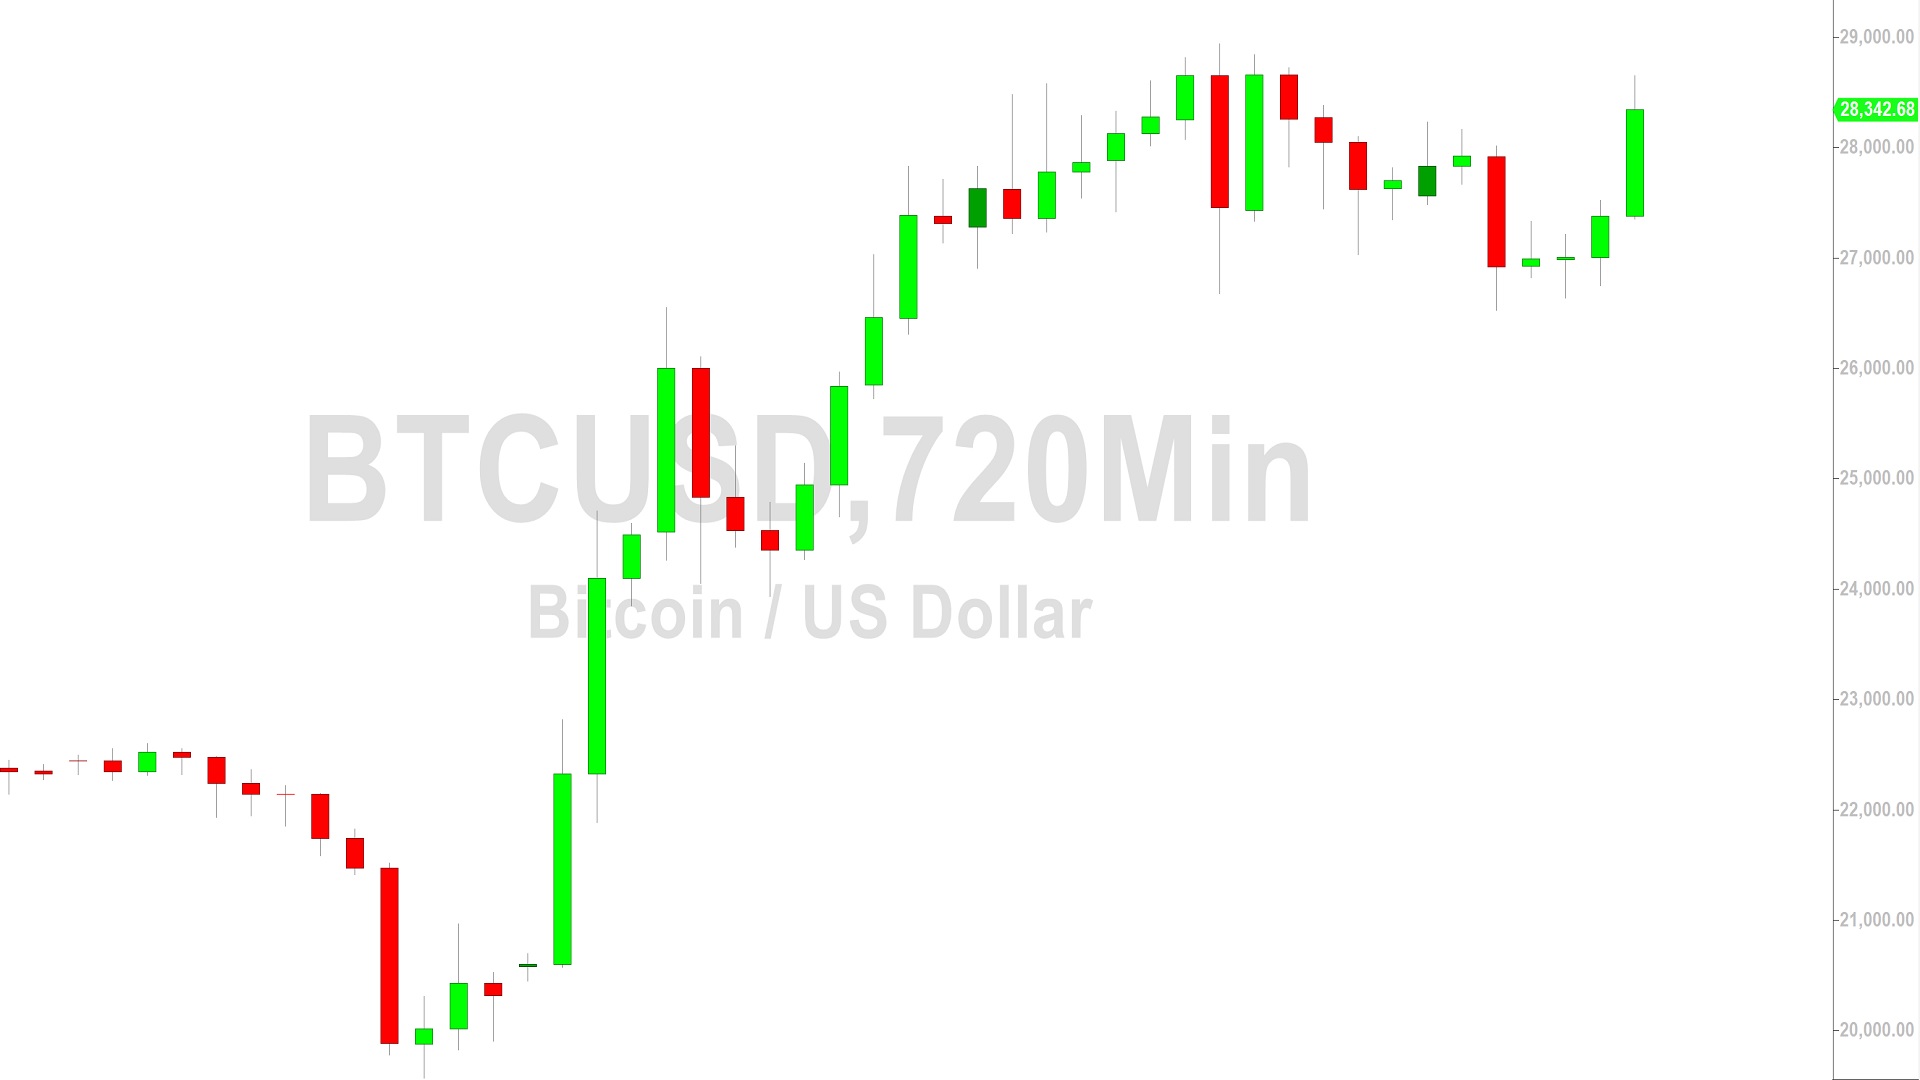
Bitcoin (BTC/USD) extended its recent glide higher early in the Asian session as the pair once again tested the 28605.40 level, an important technical level associated with selling pressure that commenced at the all-time high of 69000. Stops were elected above the 27955, 28293, and 28344 levels during the appreciation, retracement levels linked to the depreciating range from 28939.68 to 26525. Technical trading activity recently emerged when BTC/USD was supported around the 26678.16 level during the depreciation, a test of the 23.6% retracement of the recent appreciating range from 19568.52 to 28937.73. As BTC/USD approaches a recent high around the 28937.73 level, bulls are increasingly eyeing the 30127.80 area, an upside price objective linked with buying pressure around the 15460 and 19568.52 levels.
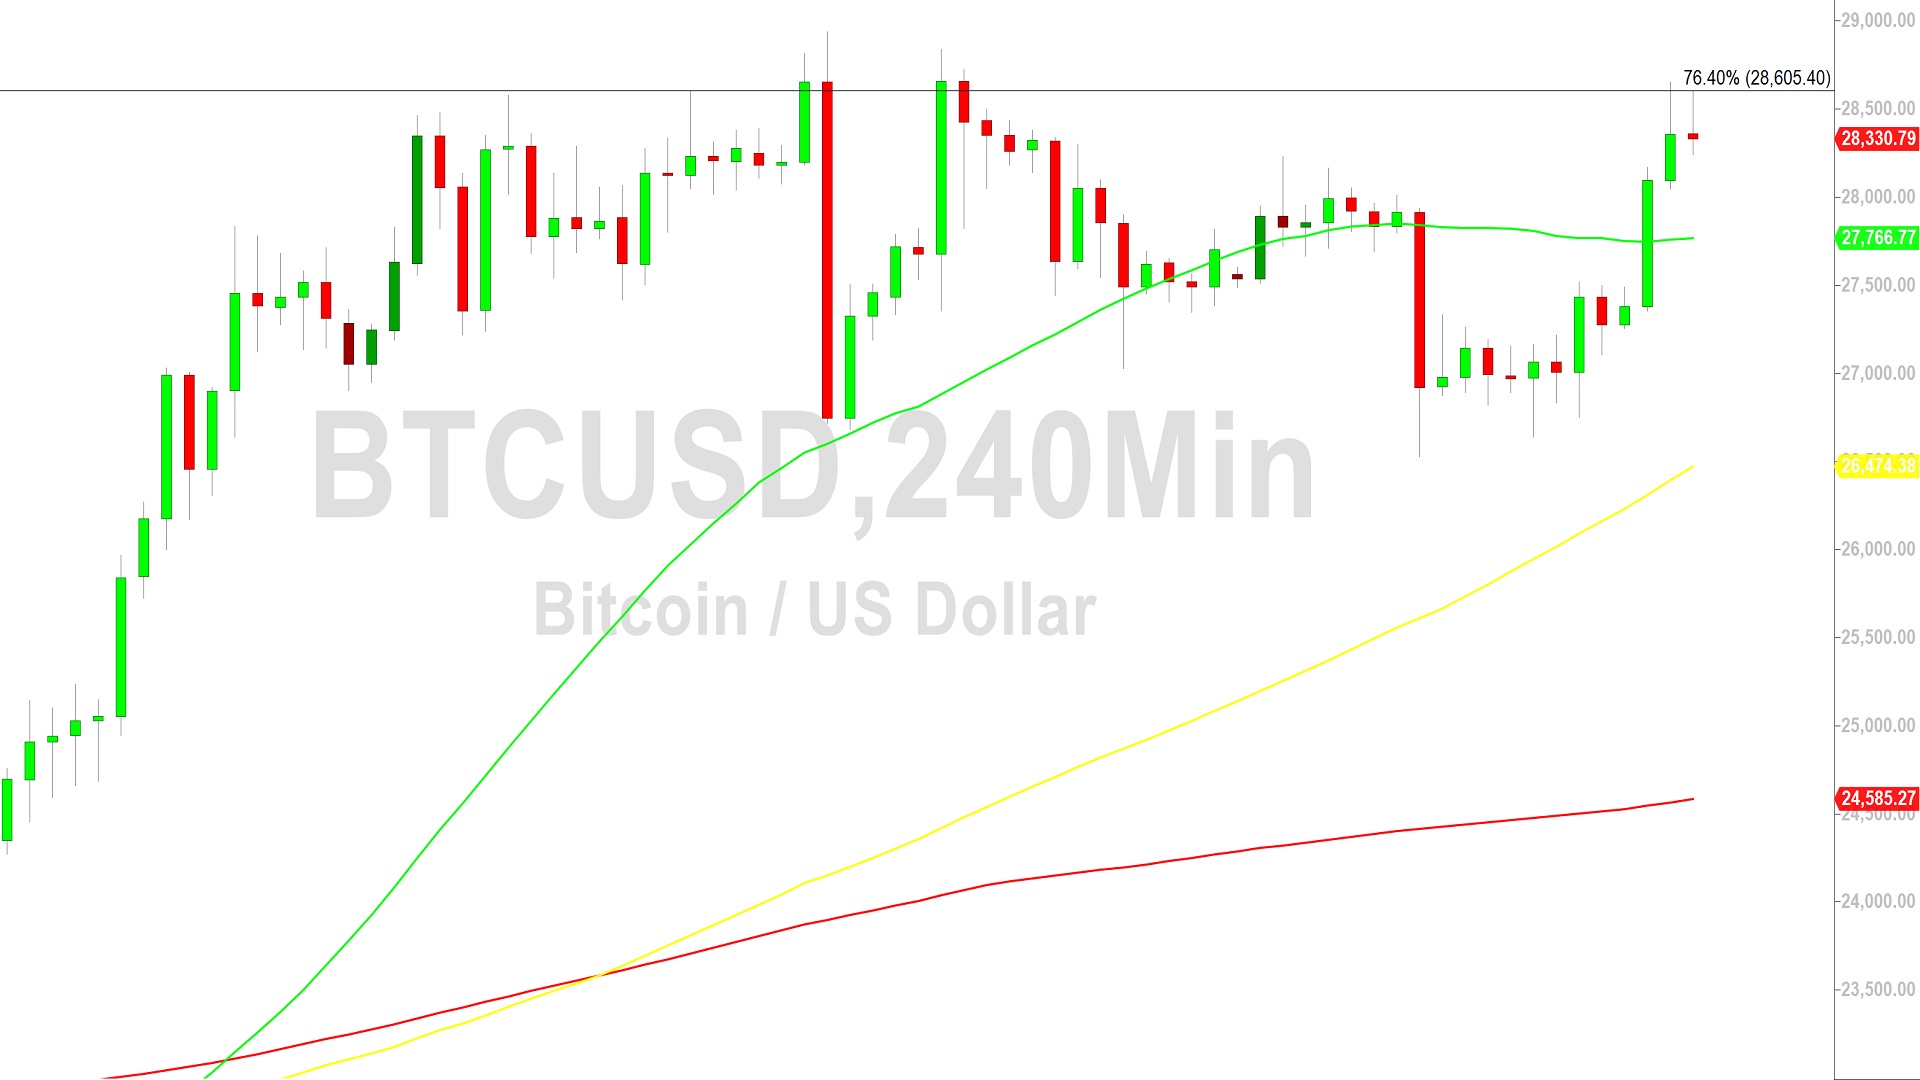
Following the recent appreciation, upside price objectives include the 29244.66, 29639.37, 30127.80, 30275.12, 30763.09, and 31477.37 levels. Following the ongoing appreciation, retracement levels and areas of potential technical support include the 25948, 25756, 25358, 24253, 24099, 23789, 23147, 22605, and 22198 levels. Below current price activity, downside price objectives include the 19266, 19132, 19106, 19006, 18981, 18919, 18822, 18116, 17720, 17523, 17457, 17230, and 17196 areas. Traders are observing that the 50-bar MA (4-hourly) is bullishly indicating above the 100-bar MA (4-hourly) and above the 200-bar MA (4-hourly). Also, the 50-bar MA (hourly) is bearishly indicating below the 100-bar MA (hourly) and below the 200-bar MA (hourly).
Price activity is nearest the 50-bar MA (4-hourly) at 27768.01 and the 200-bar MA (Hourly) at 27766.21
Technical Support is expected around 25256.83/ 24224.60/ 21753.70 with Stops expected below.
Technical Resistance is expected around 29244.66/ 29639.37/ 30127.80 with Stops expected above.
On 4-Hourly chart, SlowK is Bullishly above SlowD while MACD is Bullishly above MACDAverage.
On 60-minute chart, SlowK is Bullishly above SlowD while MACD is Bullishly above MACDAverage.
Disclaimer: Sally Ho’s Technical Analysis is provided by a third party, and for informational purposes only. It does not reflect the views of Crypto Daily, nor is it intended to be used as legal, tax, investment, or financial advice.
Investment DisclaimerDexalot Brings Its CEX-Like DEX Trading Platform To Ethereum L2 Arbitrum
Bitcoin grinds higher despite Mt Gox $9 billion BTC payout overhang