
Gold & Silver: Is It Time To Buy?
The gold market reaction continues, and the daily closing price chart does a good job of highlighting key buy zones for investors.
(Click on image to enlarge)
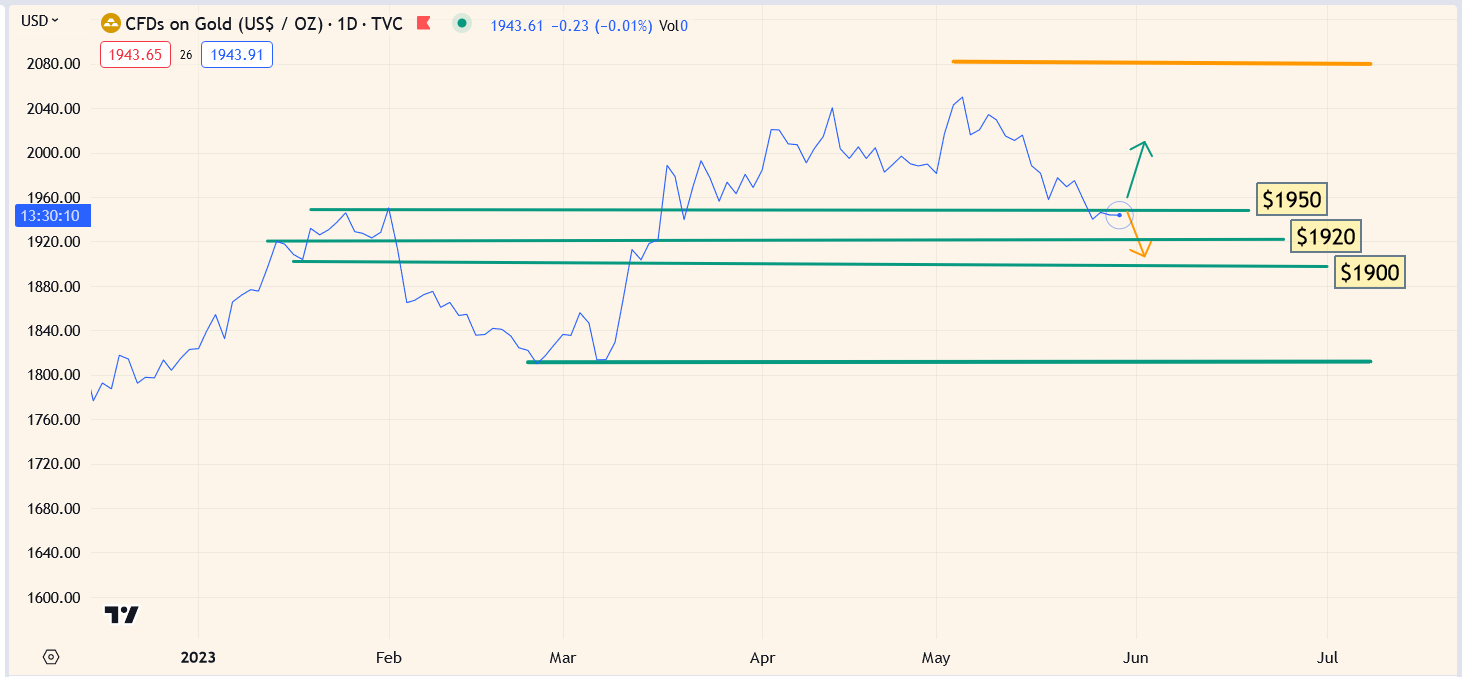
It’s clear that $1950, $1920, and $1900 are zones for action.
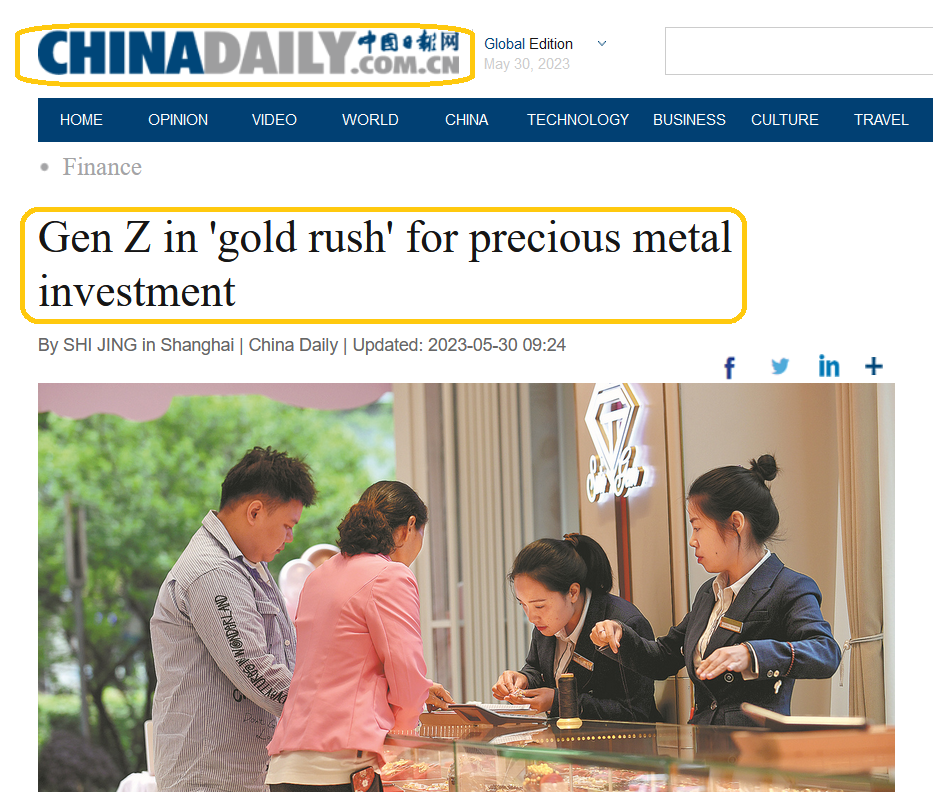
In the big picture, the economic rise of the citizens of China is a major catalyst for higher prices.
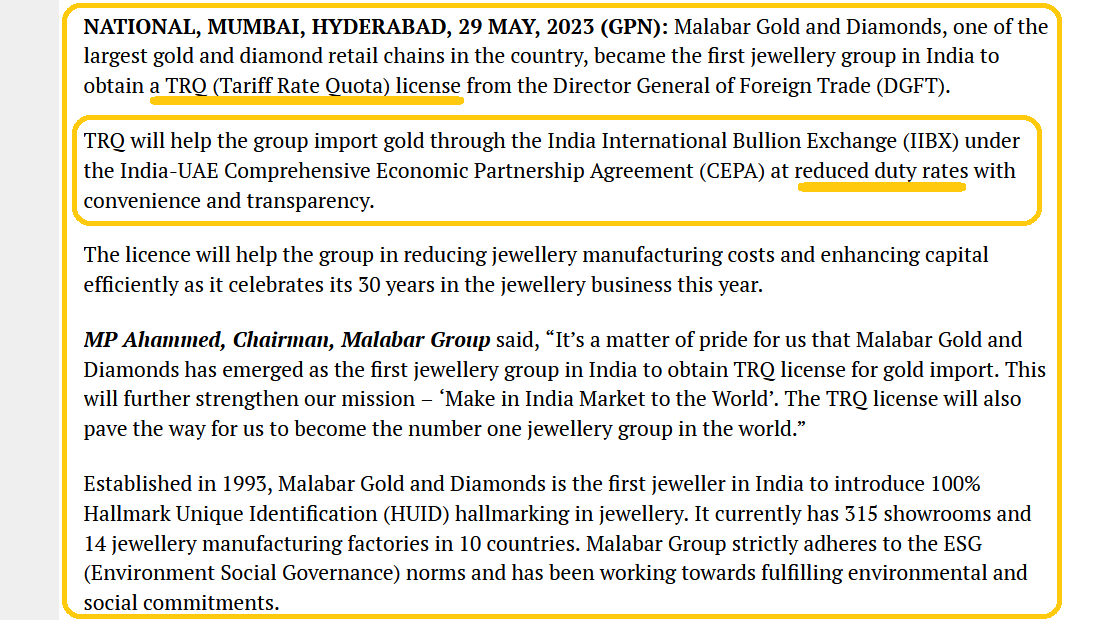
The same is true for the citizens of India.
In the medium term, it’s all about rates. American interest rates. On that note:
(Click on image to enlarge)
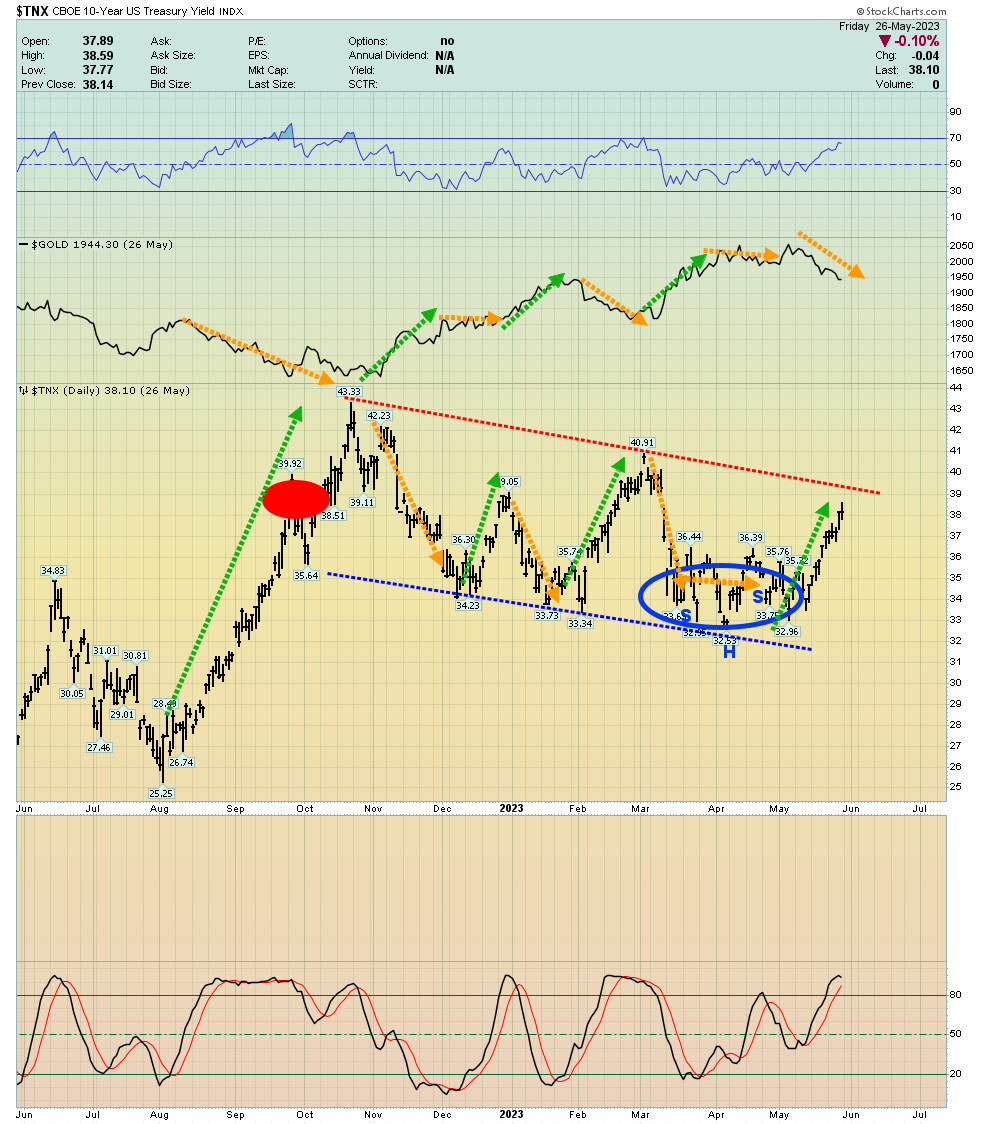
This chart highlights the gold price above the interest rate for the ten-year bond.
While gold can rally when rates rise, inflation must be surging for that to happen… and that’s simply not the case today.
The good news is that most of the interest rate rallies last for only 1-2 months, and the current one is long in the tooth. The Stochastics oscillator (14,7,7 series) is looking toppy as well.
The Fed-watched PCE rose slightly to 4.70%, but that’s not likely enough to stop a pause in rate hikes from beginning in June.
The only question is whether there’s one more hike at the June 14 Fed meeting, or if the pause begins then.
(Click on image to enlarge)
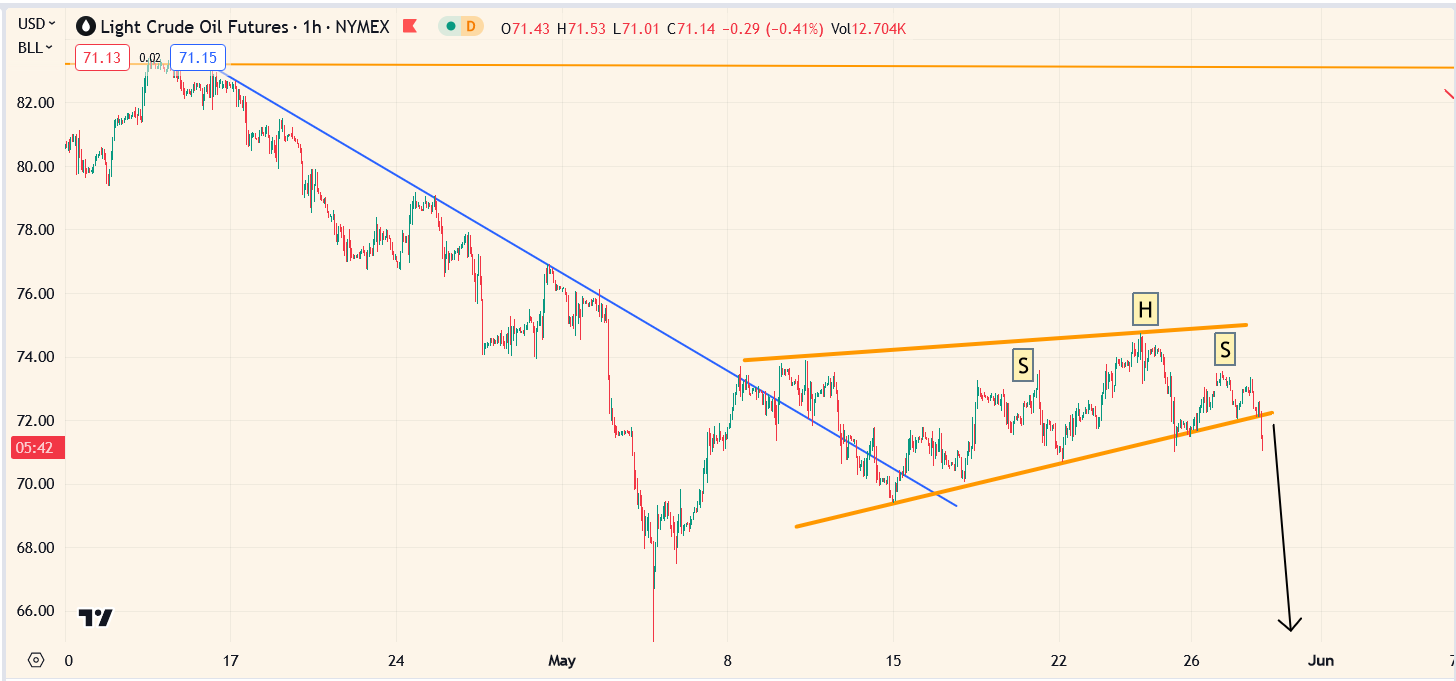
short-term oil chart.
Huge rallies in oil create big spikes in inflation… and rallies in gold.
But gold is the “ultimate asset”; a falling oil price can create a dovish Fed, which is also good for gold.
Right now, oil looks vulnerable to a fresh decline. The vulnerability may be caused by a delay in implementing Russian oil supply cuts that were part of the latest OPEC agreement.
It could also be related to “less recovery than expected” in China and a possible US recession.
Regardless, a big oil price rally or a decent decline are both positive drivers for gold!
What about silver?
(Click on image to enlarge)
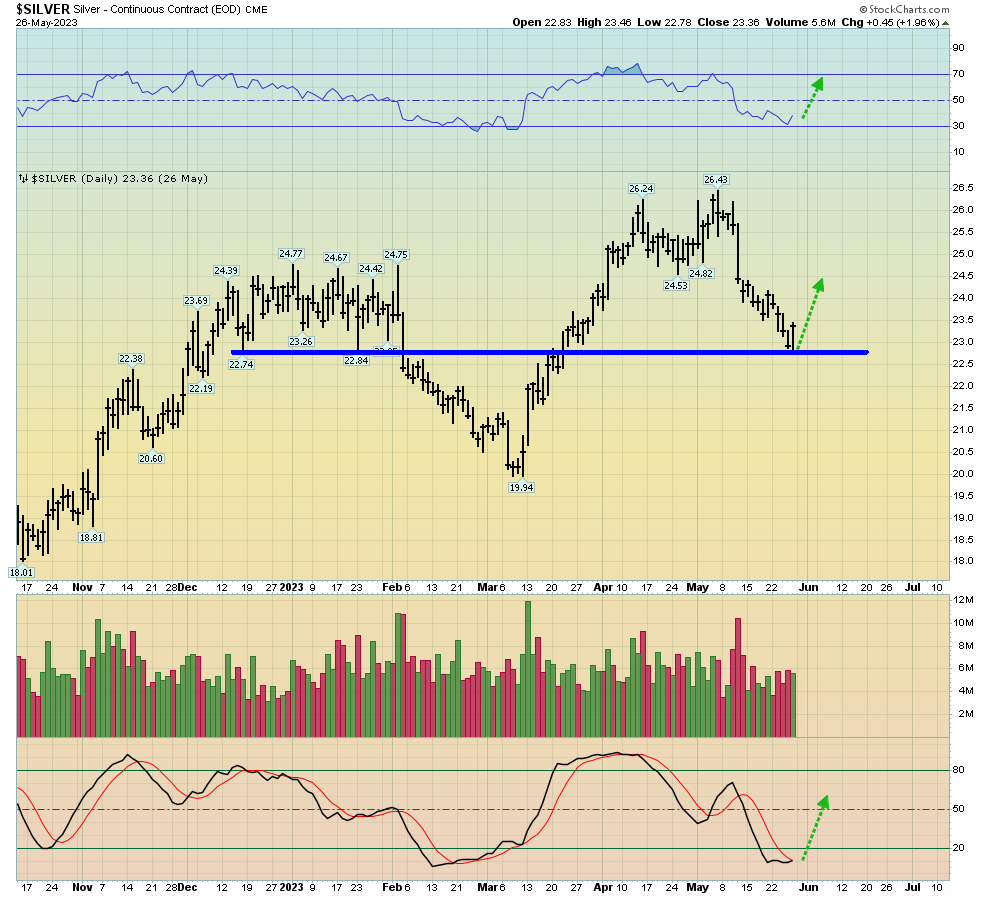
enticing daily chart for “Prince Hi Ho”.
With gold looking decent at $1950 support, silver could be poised to stage quite a violent rally.
Next:
(Click on image to enlarge)
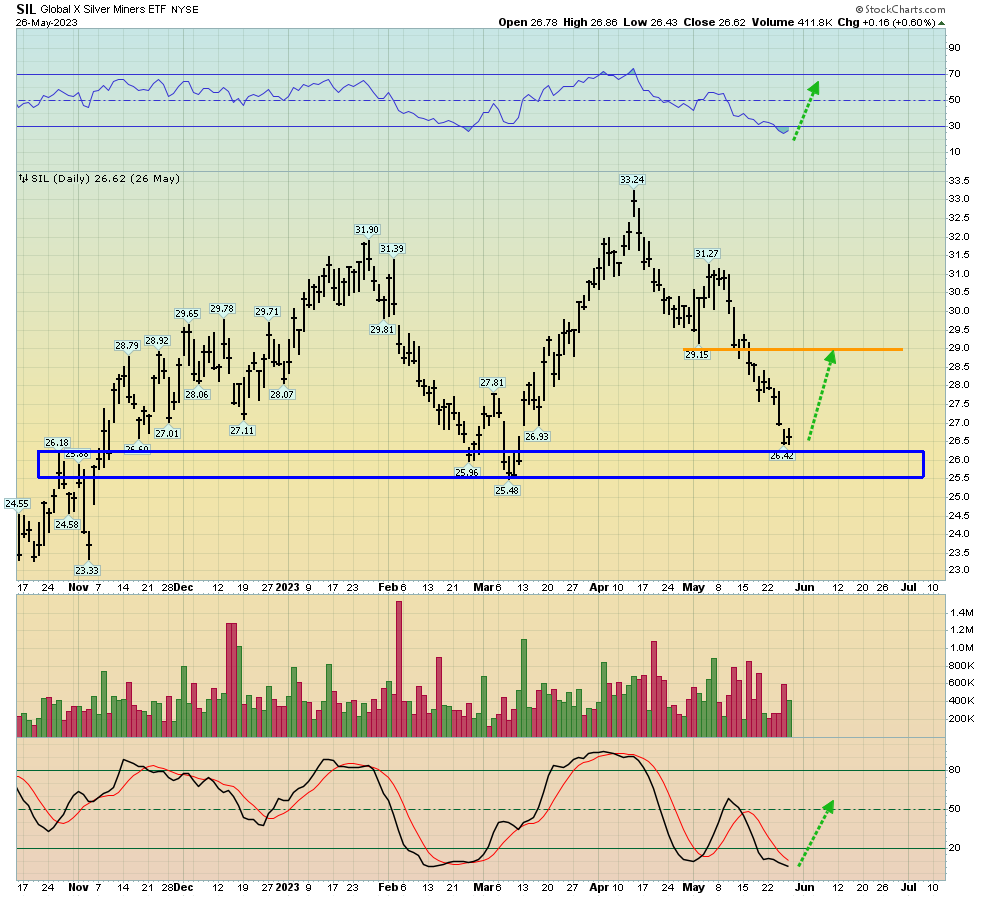
Unfortunately, the silver stocks haven’t fared as well as silver itself.
Still, a rally in silver should see the miners rally by 10% or more, and do it quickly. Aggressive investors can buy now, while those who are more conservative may want to buy only if gold trades at $1920 or $1900.
(Click on image to enlarge)
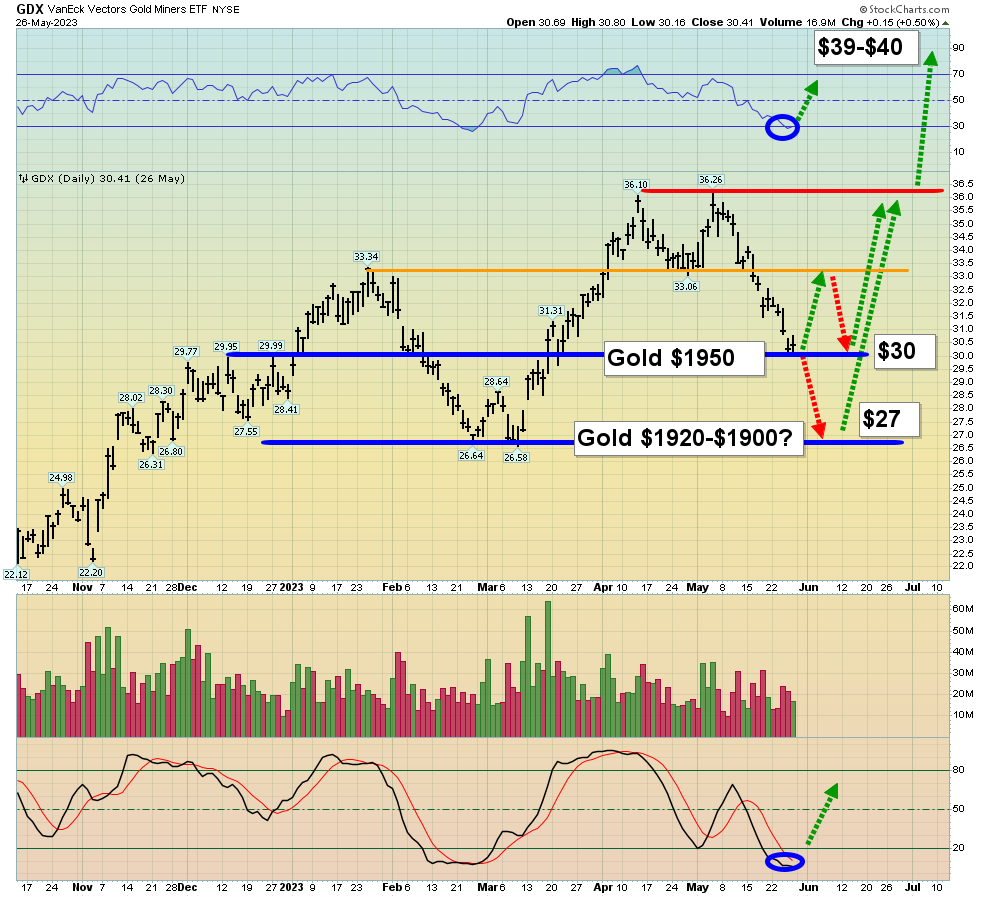
GDX chart. It looks perkier than SIL, and that could be because silver stocks have an industrial component, while gold stocks are simply miners of the ultimate safe haven asset.
Tactics? Aggressive players need to take action right now. GDX could surge 10% higher in just weeks or even days!
Conservative investors should wait for gold to experience a deeper dip to $1920-$1900. That may not happen, but if it does it could put GDX at about $27, and from there, a massive rally would be a near-certainty.
(Click on image to enlarge)
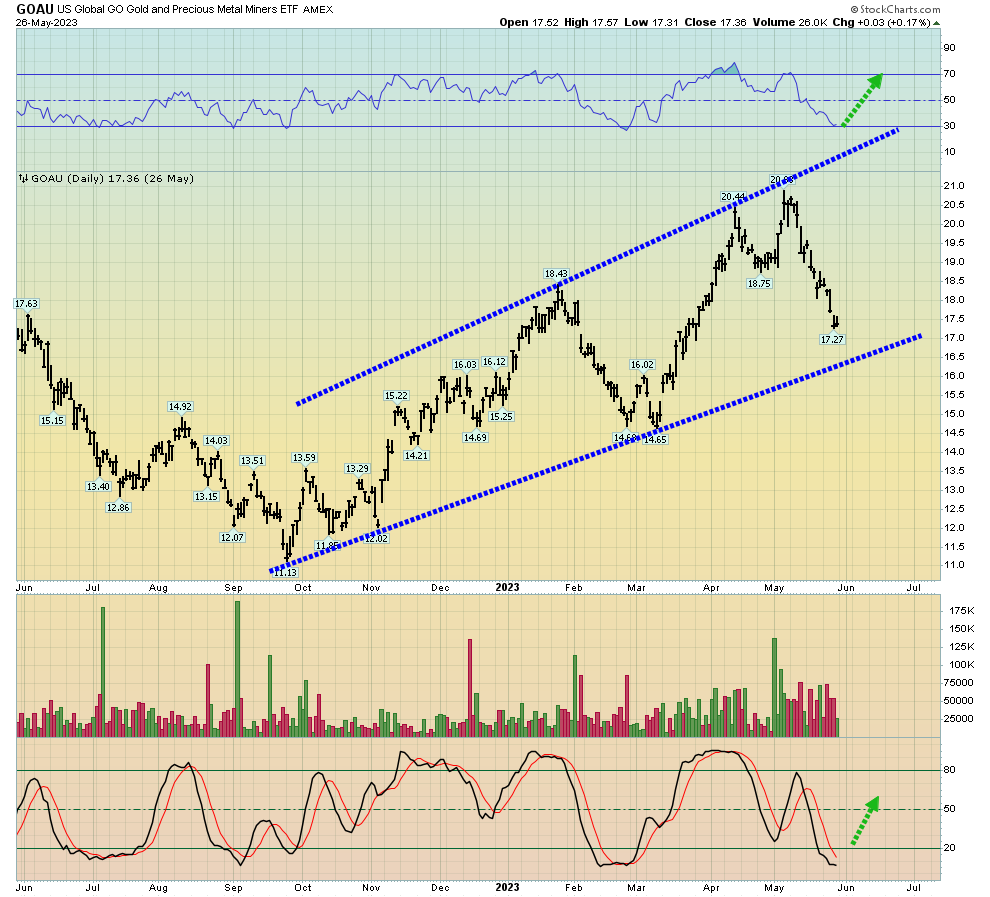
Some investors prefer GOAU to GDX. I like both, but then again, I like anything involving gold!
For GOAU, momentum players should watch for a bullish cross of my 14,7,7 Stochastics oscillator that sees the lead line push over the 20 zone. Gold market reactions are never fun, especially for those invested in the miners, but the rallies that inevitably follow always turn that modest pain into the greatest joy!
More By This Author:
Rally Time For Gold
Inflation In 2023 - A Lull In An Era
Gold Another Leg Higher


