Published
10 months ago on
May 31, 2023
BTC/USD Stops Elected Below 27477: Sally Ho’s Technical Analysis – 31 May 2023
Bitcoin (BTC/USD) extended its recent bearish momentum early in the Asian session as the pair continued to trade below the 27169.14 level, representing the 50% retracement of the recent appreciating range from 25864.35 to 28473.93. Large Stops were elected below the 27477.07 area during the depreciation, representing the 38.2% retracement of the same appreciating range, before BTC/USD bottomed out around the 26978.45 area. Technical trading became evident when this relative low was right around a downside price objective related to selling pressure that strengthened around the 28473.93 and 28057.23 areas. Downside price objectives linked to the 28057.23 and 27875 levels include the 26744, 26526, 26335, and 25675 areas. Stops are cited below the 26861 and 26422 levels.
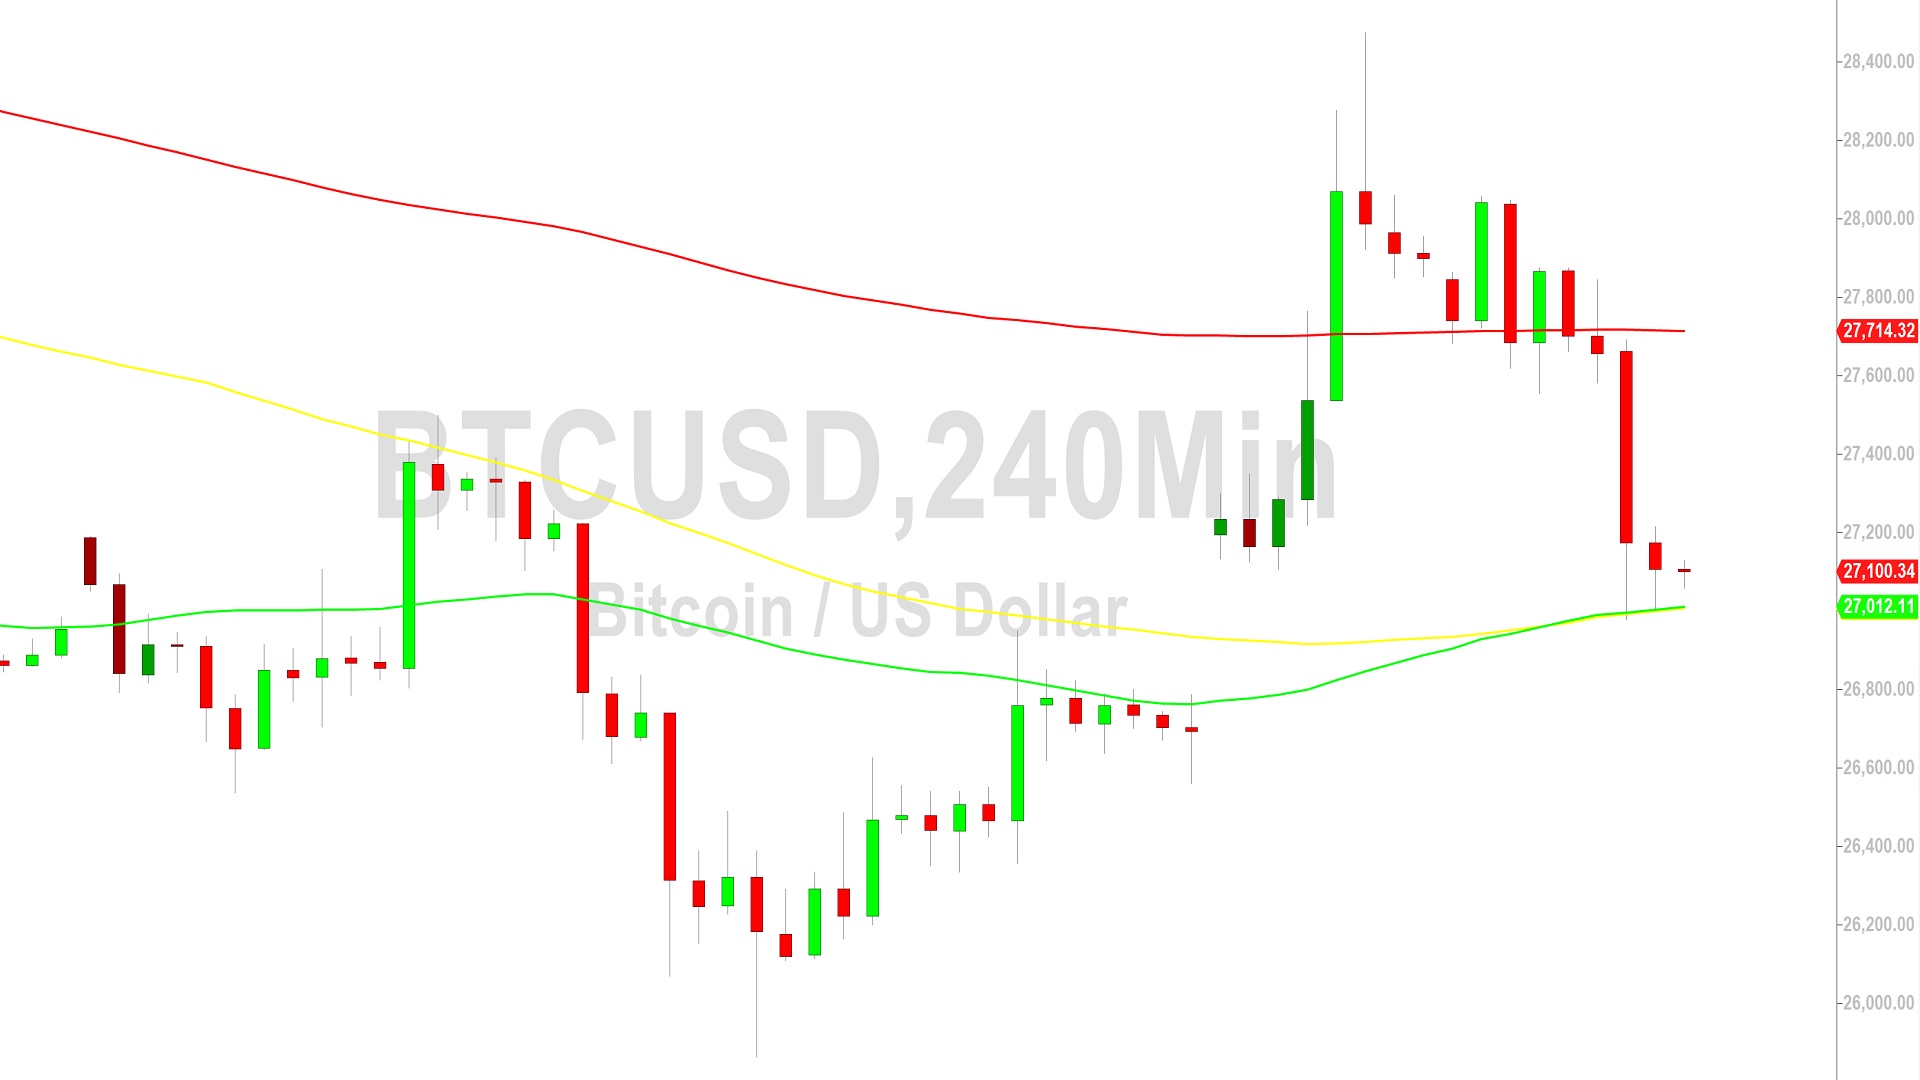
Additional downside price objectives include the 25474, 25442, 24705, 24440, 23208, and 22769 levels. Following recent price activity, areas of technical resistance and potential selling pressure include the 29048, 29143, and 29813 levels. Upside retracement levels in recent depreciating ranges include the 28700, 28741, 28868, 29243, 29299, and 29284 levels. Above the market, upside price objectives include the 30420.74, 31237.11, 31477.37, 32501.23, 32556.73, 32989.19, 34583.96, 34658.69, 35222.66, 37765.28, and 38403.97 levels. Traders are observing that the 50-bar MA (4-hourly) is bearishly indicating below the 200-bar MA (4-hourly) and above the 100-bar MA (4-hourly). Also, the 50-bar MA (hourly) is bullishly indicating above the 100-bar MA (hourly) and above the 200-bar MA (hourly).
Price activity is nearest the 50-bar MA (4-hourly) at 27011.61 and the 200-bar MA (Hourly) at 26988.19.
Technical Support is expected around 25604.51/ 24440.41/ 22769.39 with Stops expected below.
Technical Resistance is expected around 31986.16/ 32989.19/ 34658.69 with Stops expected above.
On 4-Hourly chart, SlowK is Bearishly below SlowD while MACD is Bearishly below MACDAverage.
On 60-minute chart, SlowK is Bearishly below SlowD while MACD is Bearishly below MACDAverage.
Disclaimer: Sally Ho’s Technical Analysis is provided by a third party, and for informational purposes only. It does not reflect the views of Crypto Daily, nor is it intended to be used as legal, tax, investment, or financial advice.
Investment DisclaimerMust-Buys For Turning $1,000 into $50,000 in 2024: Solana (SOL), Pepe (PEPE), and PawFury (PAW)
Stripe Revives Crypto Payments After 6-Year Hiatus, Starts With USDC