
Dollar Throttling Gold

Image Source: Pixabay
Gold just suffered a sizable down day after the latest CPI inflation printed hotter than expected. With gold falling back under the psychologically-heavy $2,000 level, bearishness flared. But with gold’s technicals remaining strong and bullish, that was misplaced. While gold has powered higher on balance for years, its ascent rate is throttled by the US dollar. Its surges on Fed-hawkish news temporarily retard gold’s advance.
Trading success demands suppressing our own greed and fear, maintaining emotional neutrality. That’s hard when prices move fast, overwhelming our sentiment through our innate immediacy bias. We traders overweight the latest market action when making decisions, often extrapolating it continuing indefinitely. The remedy for this is actively maintaining perspective, only considering recent market action in broader context.
Gold dropped 1.3% to $1,993 on Tuesday’s latest US Consumer Price Index inflation report for January. That was gold’s worst down day and first sub-$2,000 close since mid-December. Both headline and core prices in both monthly and annual terms climbed faster than economists’ forecasts. The former rose 3.1% year-over-year last month, hotter than the +2.9% expected. That made it harder for the Fed to cut rates.
Futures-implied odds for the maiden cut of this cycle coming at the next mid-March FOMC meeting fell to just 8%, while the total expected Fed rate cuts in 2024 dropped to 95 basis points. Just a month earlier, they had been running 80% and 170bp! With higher rates being more likely for longer, the benchmark US Dollar Index surged a big-for-it 0.7%. That unleashed what had to be sizable-to-large gold futures selling.
Gold’s 1.3% tumble back under $2,000 after that Fed-hawkish hotter CPI really spooked traders. That was sure evident in the leveraged gold proxies of silver and the leading GDX gold-stock ETF plunging by 2.9% and 5.1% that day. Absurdly those major gold stocks were crushed back down to early-October levels, when this gold upleg was born near $1,820!Yet gold itself remained fully 9.5% higher after that CPI.
So the bearish impact on gold sentiment Tuesday was much worse than its down day warranted. Being in the financial newsletter business, I hear from lots of traders. My e-mail traffic was pretty dejected after that CPI upside surprise, filled with worries gold was in trouble. Several people even warned me about an ominous new gold downtrend! That really piqued my interest, leaving me searching for it on the charts.
Longer-term price charts are the best tool for maintaining perspective, providing essential context for framing the latest market action. Here gold is superimposed over the USDX during the last several years or so. While gold’s post-CPI drop sure felt bad, it is barely noticeable in the grand scheme. Gold is still way up near nominal record highs, with both its latest bull upleg and longer secular uptrend remaining intact.
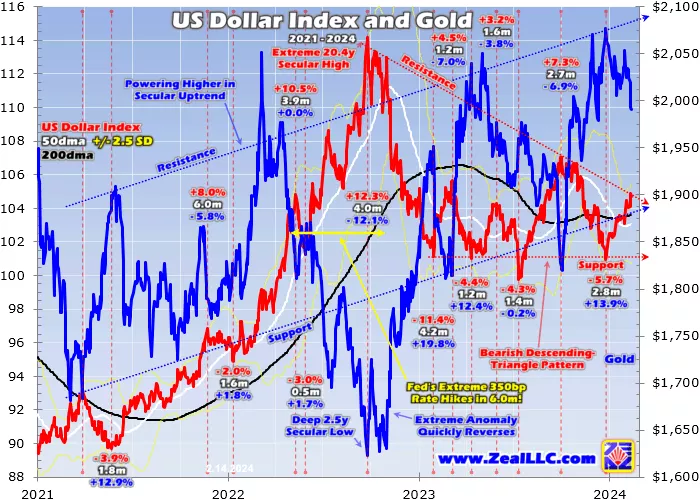
Despite this week’s latest hotter-CPI-hawkish-Fed scare, gold’s technicals look great. It has rallied on balance for several years, from averaging about $1,793 in Q1’21 to a near-record $1,976 in Q4’23. Gold has blasted up 28.0% at best within this span, mostly meandering inside this uptrend’s lower support and upper resistance. Even after this week’s selloff, gold remains on the higher side of this uptrend channel.
Gold doesn’t just look really bullish strategically, but tactically. Since early October, gold’s latest upleg had surged 14.2% at best into late December’s latest nominal record high. As of Wednesday, gold had only given back a third of those gains in its latest pullback. Such selloffs are inevitable and essential within ongoing uplegs, bleeding off excessive greed to rebalance sentiment. That’s necessary to keep uplegs healthy.
Even after that hotter CPI print, gold’s latest pullback is just down 4.2% over the past seven weeks or so! That remains mild by gold-pullback standards, far from upleg-slaying 10%+ correction territory. So those bearish gold-in-a-downtrend fears are flat-out wrong! Gold remains just 4.3% under more record highs, it sure isn’t beaten down. And this dollar-gold chart reveals the reason gold has pulled back in recent months.
Also since late December, the US Dollar Index has bounced 3.9% at best. The dollar’s fortunes throttle gold, regulating the speed of its bull-market ascent. Gold’s 4.2% pullback is inversely proportional to the USDX’s latest bear rally. This is nothing new, gold tends to rally when the dollar weakens then retreat as it strengthens. That is readily evident visually in this chart, which is sliced up showing the dollar’s big swings.
These blue and red lines usually move in opposition, one rallying while the other sells off. And there is often symmetry to their moves. That was illustrated in spades in mid-2022. In just 6.0 months, the Fed’s Federal Open Market Committee hiked its federal funds rate by an extreme 350 basis points! Frantically trying to contain inflation raging out of control, that nearly tripled the usual 125bp pace across five FOMC meetings.
Those crazy rate hikes including four 75bp monsters in a row ignited one of the most-powerful USDX surges on record. It blasted an enormous 12.3% higher in just 4.0 months, slamming gold a proportional 12.1% lower. With the Fed running out of room to keep hiking huge and the USDX rocketing parabolic to unsustainable 20.4-year secular highs, that extreme anomaly couldn’t last and indeed soon reversed hard.
Gold had been slammed far under its uptrend’s support, hitting a deep 2.5-year secular low at its nadir. Right around there I argued the Fed’s dollar/gold shock was ending. Indeed the USDX plunged 11.4% over the next 4.2 months, helping catapult gold a massive 19.8% higher! That uptrend breakdown proved short-lived and was quickly unwound. Ever since, dollar-gold interactions have been a microcosm of that.
Gold and the USDX have alternated rallying and selling off over the past 14 months or so. Gold is strong when the dollar weakens, and vice versa. This opposing dynamic generally works over months, weeks, and even days as seen after this new January CPI. This inverse correlation isn’t only visual, but easy to quantify empirically. Again the USDX’s major rallies and selloffs in recent years are carved into this chart.
Between early 2021 to late 2023, the dollar enjoyed six big rallies averaging 7.6% gains. Gold fell during the exact spans of five of those, and was flat during the sixth. Gold’s average losses during these recent USDX rallies weighed in at 5.9%. The yellow metal generally retreated less than the greenback surged, one key reason gold’s strong secular uptrend exists. But gold also outperformed during intervening dollar selloffs.
The USDX suffered seven selloffs in these last several years, averaging 5.0% losses. Gold surged during six of those, and was largely unchanged in the seventh. Its strong average gains of 8.9% almost doubled the dollar’s losses. That enabled gold to blast up 28.0% at best during the past few years, despite the USDX also climbing on balance. It averaged 91.0 in Q1’21 and 104.6 in Q4’23, making for big 14.9% gains.
Yet despite the dollar’s formidable strength, average gold prices in those bookending quarters still surged an impressive 10.2%!So while the dollar certainly throttles gold’s ascent rate, it doesn’t control gold’s fortunes. Gold can and does power higher on balance even while the USDX strengthens. But most of gold’s gains accrue during dollar selloffs within that span. Gold is sure sensitive to USDX meanderings.
The reason is gold futures trading, which dominates gold’s near-term price action. Understanding how this works is essential if you want to trade gold, silver, and their miners’ stocks. Leverage allowed in gold futures is extreme, running as high as 24.0x mid-week!For traders daring to bet at that full 24x, a mere 4.2% gold move against their positions wipes 100% of their capital risked!They can’t afford to be wrong for long.
That necessitates shrinking their trading time horizons to the ultra-short-term, days or maybe weeks on the outside. They can’t care about gold’s bullish fundamentals including massive underinvestment and colossal global money-supply growth. All that matters is what gold is likely to do immediately. So these super-leveraged traders fixate on the US dollar’s fortunes, moving quickly to do the opposite in their trading.
Leading into this Tuesday’s CPI print, gold was stable near $2,029. That was just 2.4% underachieving more new nominal record highs. In the hours before the CPI’s release, the USDX was drifting lower to 104.0. Yet when that CPI inflation came in hotter, within minutes the USDX soared 0.6% vertically to hit 104.6! Gold was slammed immediately on what looked like sizable gold futures selling, plunging sharply.
When the dust settled that day, the USDX had rallied 0.7% while gold dropped 1.3%. Unfortunately, the gold-futures specs’ crazy leverage grants them outsized influence on gold prices. At that 24x maximum, each dollar traded in gold futures has 24x the gold-price impact as a dollar invested outright! Giving these guys even more power, the resulting gold-futures price is gold’s world reference one that investors watch.
So sharp gold-futures-driven gold selloffs really taint investors’ sentiment. They see gold drop and grow bearish, even though heavy gold-futures selling is quite finite and quickly exhausts itself. That yields to proportional normalization buying, so gold soon blasts back higher in symmetrical mean-reversion rallies. This scenario played out in early October, when today’s upleg was birthed in anomalous gold-futures selling.
Surprisingly the Fed’s interest-rate levels aren’t too important for gold. Before the FOMC launched its monster rate-hike cycle in March 2022, I did a comprehensive study on gold’s behavior during all past Fed-rate-hike cycles of the modern monetary era since 1971. Through the exact spans of all twelve of them, gold averaged excellent 29.2% gains!It is the US dollar that is sensitive to rates, not gold directly.
Currency traders always look to yield differentials between competing pairs. Higher odds of Fed hikes or cuts affect expected yields relative to other major currencies like the euro. So the US dollar is bid higher on any news that implies more hikes coming, higher rates for longer, or less cuts. That includes top Fed officials’ speeches, FOMC decisions and accompanying rate projections, and major economic data like that CPI.
Had the USDX not surged Tuesday on prospects for the FOMC keeping its FFR higher for longer, gold wouldn’t have plunged. The gold-futures guys don’t care about Fed rate odds, but they fade the USDX which does. A recent case in point was the December monthly US jobs report released in early January. That proved Fed-hawkish, coming in better than expected at +216k jobs versus +170k on January 5th.
That suggested the US economy remains robust, so Fed-rate-cut odds for the March FOMC meeting and all of 2024 fell considerably that day to 66% and 138bp. Yet gold held strong, drifting sideways in a flat day because the USDX only edged up 0.1%. There are plenty examples of gold ignoring shifting rate odds because the USDX didn’t move. They only matter to gold because gold-futures specs watch the dollar.
A month ago after cooler-than-expected December PPI wholesale inflation, March rate-cut odds surged to 80% with traders pricing in 170bp of cuts in 2024. Again after this week’s CPI, those had collapsed to just 8% and 95bp!Interestingly rate odds are cyclical much like the USDX and gold, tending to oscillate from one extreme to the other. So there’s a good chance they’re due to rebound on more-Fed-dovish newsflow.
That could include cooler-than-expected key economic data, or even less-hawkish Fedspeak as top Fed officials increasingly fear another regional-bank crisis. Whatever happens, the US Dollar Index’s outlook is very bearish. Since shooting parabolic in mid-2022 to unsustainable secular extremes, the USDX has ground lower to sideways in a massive descending-triangle technical pattern portending a bearish breakdown!
These are a type of continuation pattern, revealing weakening demand. Prices get compressed between falling upper resistance and flat lower support, until they eventually break out to the downside. That major technical failure in the USDX is likely in coming months, auguring much-lower dollar levels. That dollar selling will attract big gold-futures buying, catapulting gold’s upleg deep into record territory sparking much interest.
The US dollar’s fundamentals are very bearish for multiple reasons, including the crazy-extreme deficits the US government is running. The US money supply also remains vastly inflated from pre-pandemic levels thanks to extreme Fed money printing. The Fed’s latest balance-sheet data shows that effective monetary base underlying the US dollar supply remains 83.5% or $3,473b higher than February 2020 levels!
With far more dollars conjured into existence by the FOMC, each should be worth considerably less. The deeper the USDX’s bear market grows, the higher gold prices will climb. The farther they forge into new-nominal-record territory above late December’s $2,077, the more bullish financial-media coverage gold will get. That will attract in legions of new traders to chase gold’s upside momentum, accelerating its upleg.
The more investors return, the more their vast pools of capital will overpower the far-smaller gold-futures specs’ leveraged impact on gold prices. The biggest beneficiaries of that will be the gold miners’ stocks, which are dirt-cheap and mostly forgotten today. That leading GDX gold-stock ETF can more than double during major gold uplegs!And smaller fundamentally-superior mid-tiers and juniors well outperform GDX majors.
The bottom line is the US dollar is still throttling gold, which is nothing new. For long years now, gold has tended to rally when the USDX is weakening and vice versa. Speculators’ super-leveraged gold-futures trading remains the dominant reason, necessitating an ultra-short-term focus. So they closely watch and fade the US dollar’s fortunes, doing the opposite. The dollar in turn is affected by changing Fed rate odds.
Yet despite this vexing opposing dynamic, gold continues powering higher on balance to reflect its bullish fundamentals. Gold has carved an impressive secular uptrend in recent years despite the USDX enjoying strong gains. Most of gold’s big upside accrued during periodic dollar selloffs, when it really outperforms. Lots more dollar weakness is coming as the USDX breaks down out of its massive bearish technical pattern.
More By This Author:
Gold Miners’ Q4’23 Preview
Gold Resists Fed Chair
Gold’s Mild Pullback


