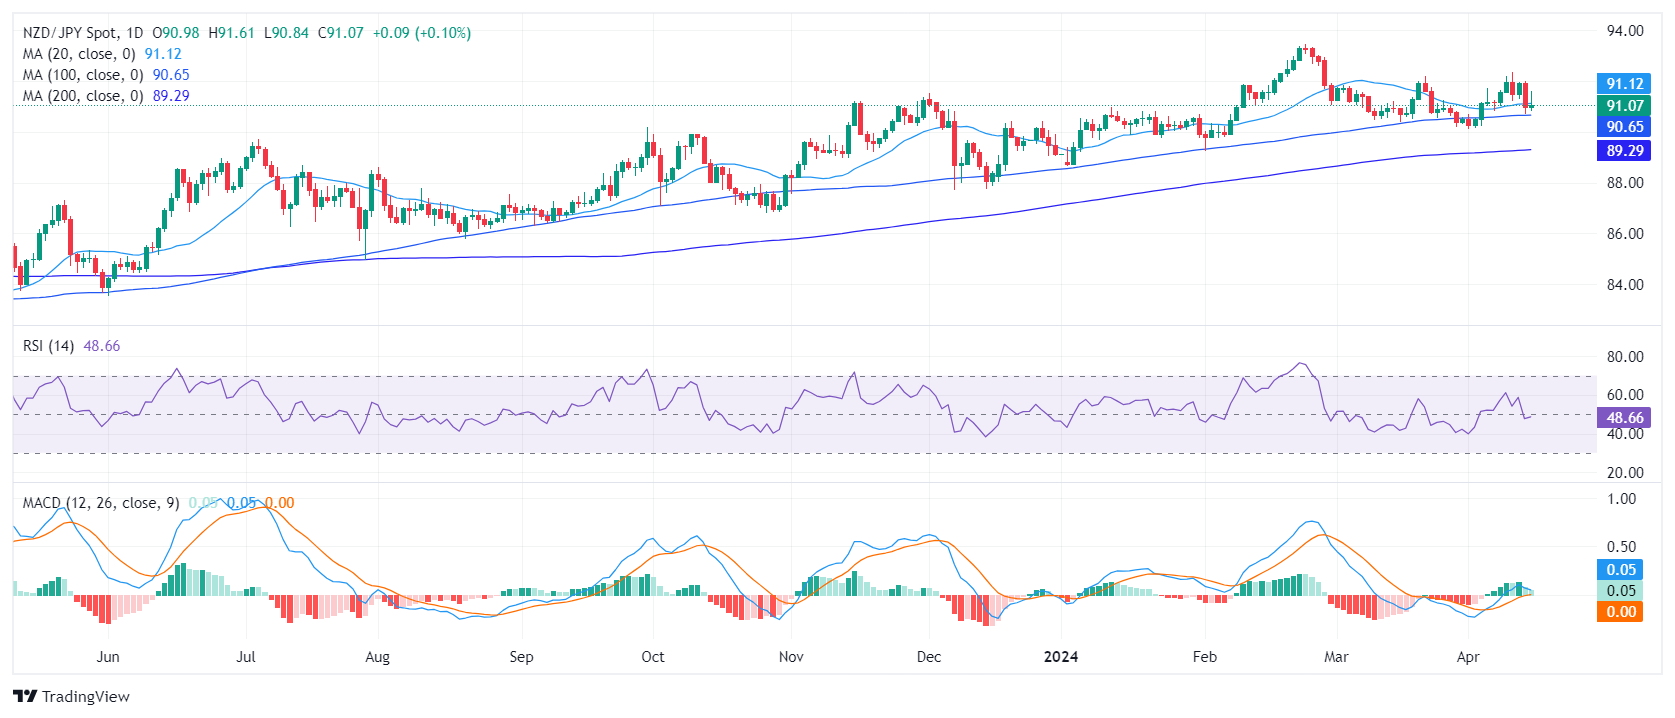
- The daily RSI and MACD reveal a weaker NZD/JPY, pointing towards bearish momentum.
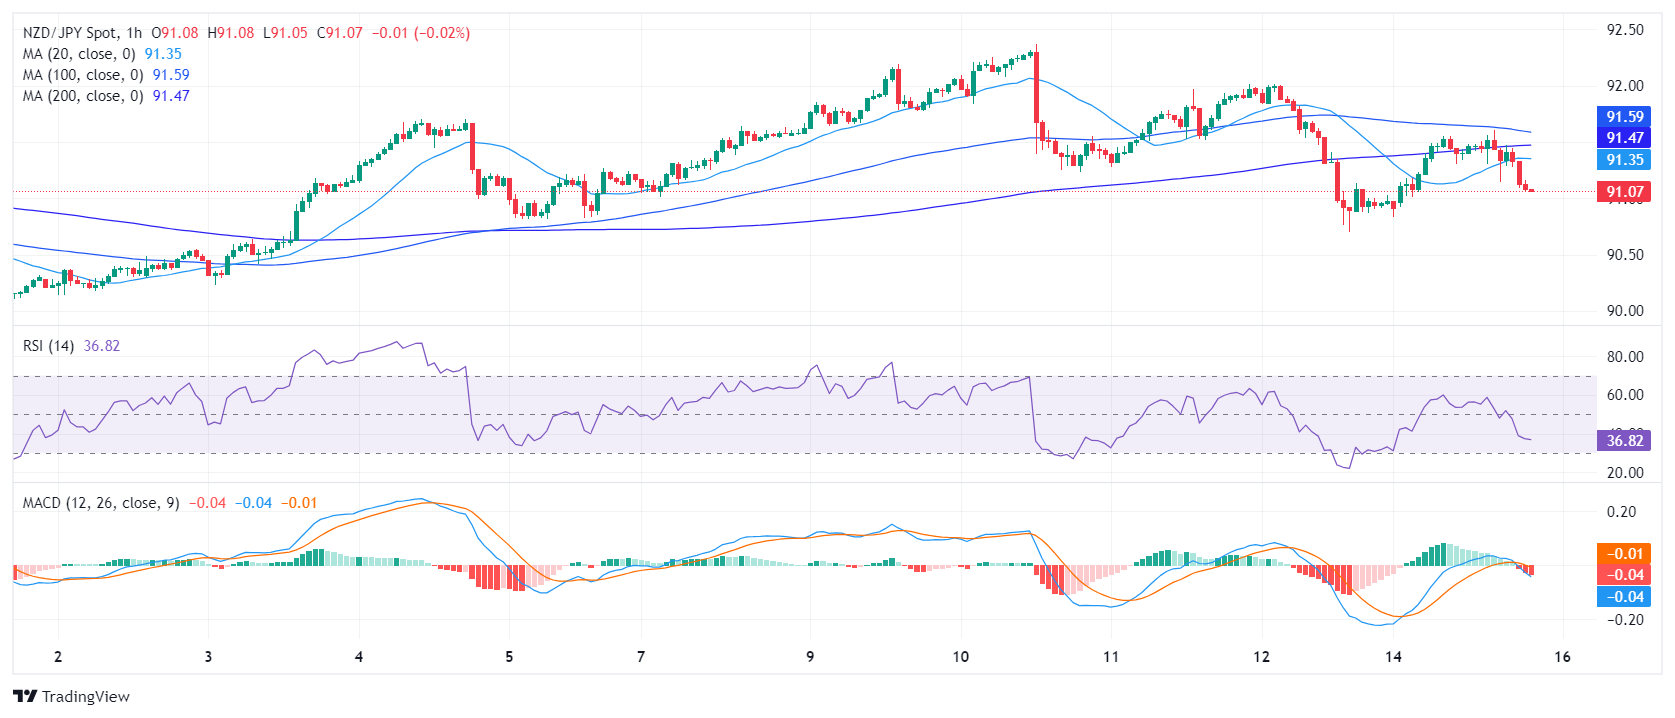
- The negative trend is stronger on the hourly chart.
- Despite short-term bearish inclination, the cross position above main SMAs signifies a bullish sentiment in the longer term.
The NZD/JPY is trading at the 91.14 level, securing some daily gains after peaking at a daily high of 91.60. Despite a bearish short-term trend, the pair maintains a bullish position over the longer term, being positioned above key Simple Moving Averages (SMAs). For the short term, bears seem to be gearing up and bulls starting to weaken.
On the daily chart, the Relative Strength Index (RSI) is currently trending in negative territory, with the latest reading of 49. This, coupled with decreasing green bars on the Moving Average Convergence Divergence (MACD) histogram, indicates a slowdown in positive momentum, suggesting that sellers are currently dominating the market.
NZD/JPY daily chart
Switching to the hourly chart, the RSI similarly shows lower readings, with the latest value at 43, signaling a stronger negative trend in this time frame. Additionally, the MACD histogram shows an increase in red bars, reinforcing the negative momentum. This shift could indicate an increase in selling pressure during recent trading sessions and that the cross may see further downside ahead of the Asian session.
NZD/JPY hourly chart
The broader inspection of NZD/JPY illustrates a mixed technical scenario according to its position relative to its Simple Moving Averages (SMAs). In the short term, bearish tendencies are apparent as the NZD/JPY fell below the 20-day SMA last week and failed to re-conquer it. This move might trigger selling pressure from a short-term perspective. However, the position of NZD/JPY above the 100-day and 200-day SMAs shows a more bullish underlying structure in longer-term horizons.
In case the bulls fail to regain the 20-day SMA, the cross might be exposed to further downside in the coming sessions.
Information on these pages contains forward-looking statements that involve risks and uncertainties. Markets and instruments profiled on this page are for informational purposes only and should not in any way come across as a recommendation to buy or sell in these assets. You should do your own thorough research before making any investment decisions. FXStreet does not in any way guarantee that this information is free from mistakes, errors, or material misstatements. It also does not guarantee that this information is of a timely nature. Investing in Open Markets involves a great deal of risk, including the loss of all or a portion of your investment, as well as emotional distress. All risks, losses and costs associated with investing, including total loss of principal, are your responsibility. The views and opinions expressed in this article are those of the authors and do not necessarily reflect the official policy or position of FXStreet nor its advertisers. The author will not be held responsible for information that is found at the end of links posted on this page.
If not otherwise explicitly mentioned in the body of the article, at the time of writing, the author has no position in any stock mentioned in this article and no business relationship with any company mentioned. The author has not received compensation for writing this article, other than from FXStreet.
FXStreet and the author do not provide personalized recommendations. The author makes no representations as to the accuracy, completeness, or suitability of this information. FXStreet and the author will not be liable for any errors, omissions or any losses, injuries or damages arising from this information and its display or use. Errors and omissions excepted.
The author and FXStreet are not registered investment advisors and nothing in this article is intended to be investment advice.
Recommended content
Editors’ Picks
EUR/USD retreats to 1.0700 after US data

EUR/USD lost its traction and turned negative on the day near 1.0700 in the American session on Tuesday. The data from the US showed that Employment Cost Index rose more than expected in Q1 and provided a boost to the USD.
GBP/USD declines toward 1.2500 on renewed USD strength

GBP/USD turned south and dropped toward 1.2500 in the second half of the day. The US Dollar gathers strength following the strong wage inflation data, forcing the pair to stay on the back foot.
Gold extends daily slide toward $2,300 after US data

Gold stays under bearish pressure and declines toward $2,300 on Tuesday. The benchmark 10-year US Treasury bond yield stays in positive territory above 4.6% after US Employment Cost Index data, weighing on XAU/USD.
XRP hovers above $0.51 as Ripple motion to strike new expert materials receives SEC response

Ripple (XRP) trades broadly sideways on Tuesday after closing above $0.51 on Monday as the payment firm’s legal battle against the US Securities and Exchange Commission (SEC) persists.
Eurozone inflation stable as the outlook on prices gets increasingly muddied

Eurozone headline inflation remains stable at 2.4%. With higher energy prices and improving domestic demand, questions about the direction of inflation become louder.