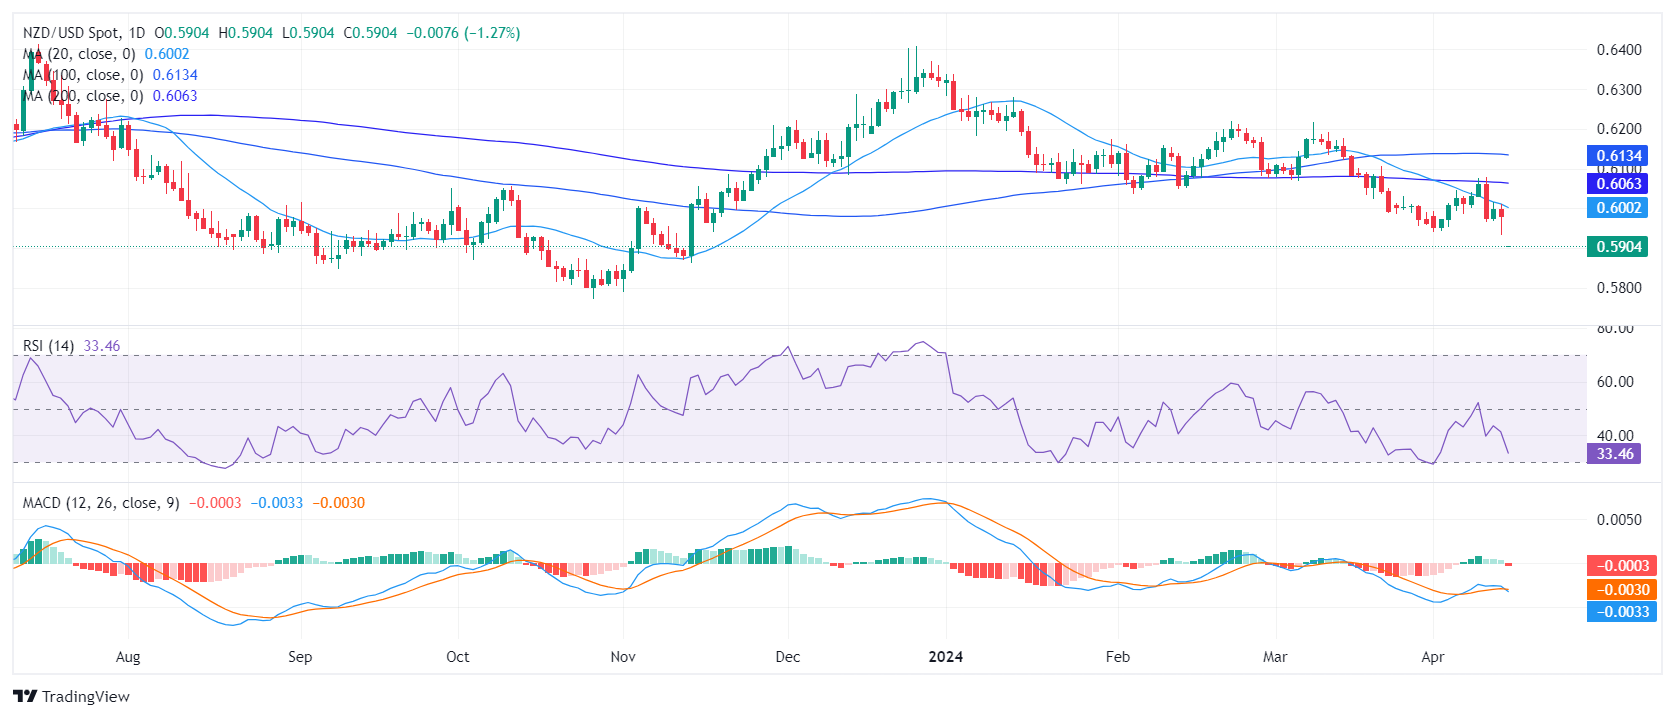
- The daily RSI reveals a negative trend for NZD/USD, suggesting prevalent selling pressure.
- As the RSI stands near oversold conditions, the daily chart hints at a potential consolidation in the next sessions.
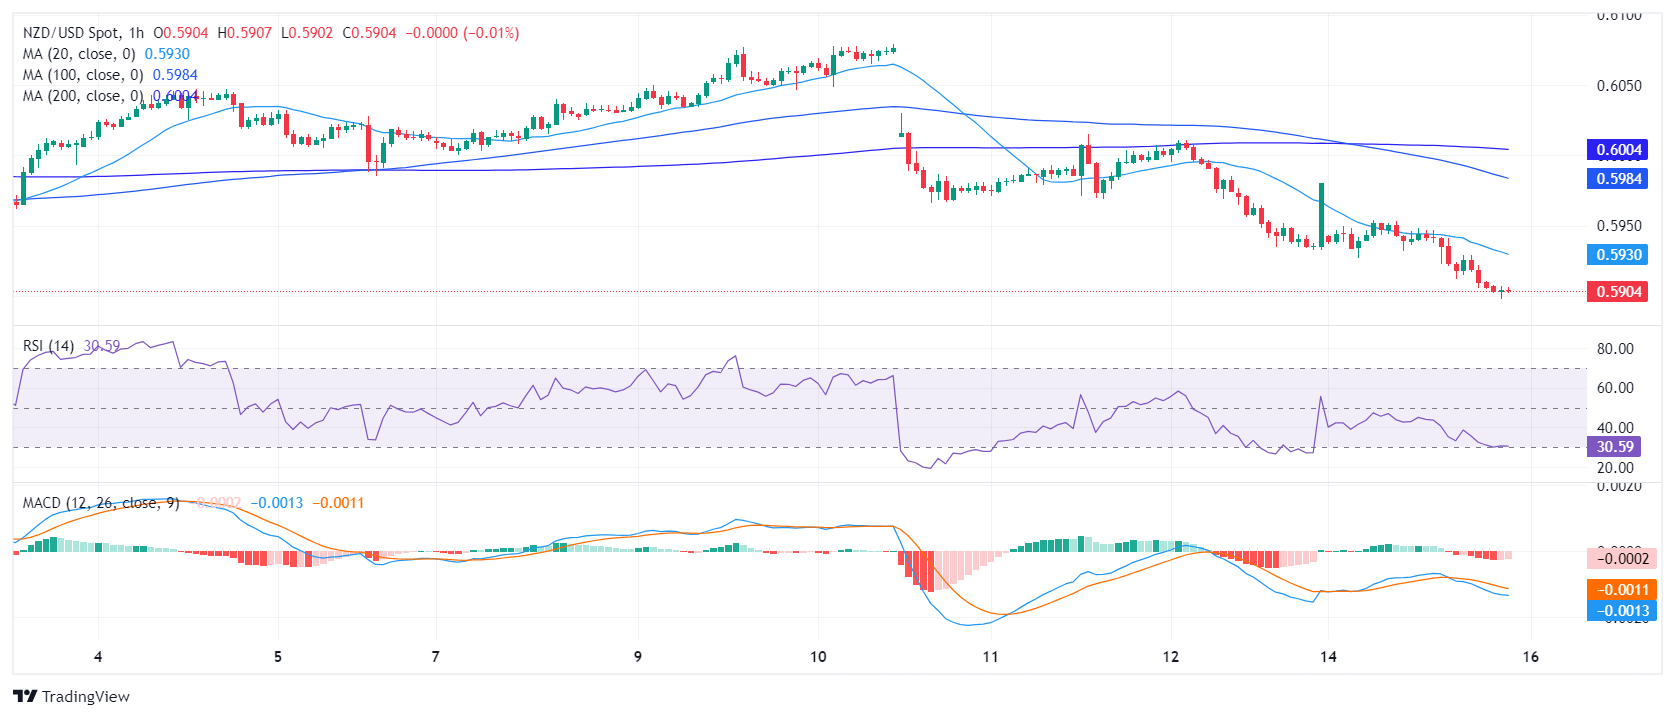
- Indicators on the hourly chart corroborate the selling bias, while subtly highlighting signs of imminent recovery.
The NZD/USD pair is currently trading at around 0.5903, suggesting a stronghold of the sellers in the market. The pair's tendency to trade below the short-term Simple Moving Averages (SMAs) indicates a short-term bearish outlook. However, with the oversold conditions looming, a possible reversal may not be too far off.
On the daily chart, the Relative Strength Index (RSI) readings have remained under a negative trend with the RSI sitting at 35, indicating a nearing oversold condition. This suggests that sellers have dominated the market in recent sessions. The negative momentum is also represented by the fresh red bar of the Moving Average Convergence Divergence (MACD), suggesting a current bearish bias. However, the nearing oversold condition signals the possibility of a trend reversal.
NZD/USD daily chart
Comparing this to the hourly chart, it is observed that the RSI values are still in the negative range and dangerously near the oversold threshold. The MACD histogram presents a flat red bar, indicating negative momentum, and essentially reaffirms the conclusion drawn from the daily charts, that the market has a prevalent selling bias, but there are signs of potential recovery.
NZD/USD hourly chart
Inspecting the broader outlook, the NZD/USD shows a negative outlook as it sits below its 20,100 and 200-day Simple Moving Average (SMA).
In conclusion, both the daily and the hourly technical outlooks suggest a bearish bias for the NZD/USD pair. However, traders should remain cautious of potential reversals given the nearing oversold condition based on the RSI readings.
Information on these pages contains forward-looking statements that involve risks and uncertainties. Markets and instruments profiled on this page are for informational purposes only and should not in any way come across as a recommendation to buy or sell in these assets. You should do your own thorough research before making any investment decisions. FXStreet does not in any way guarantee that this information is free from mistakes, errors, or material misstatements. It also does not guarantee that this information is of a timely nature. Investing in Open Markets involves a great deal of risk, including the loss of all or a portion of your investment, as well as emotional distress. All risks, losses and costs associated with investing, including total loss of principal, are your responsibility. The views and opinions expressed in this article are those of the authors and do not necessarily reflect the official policy or position of FXStreet nor its advertisers. The author will not be held responsible for information that is found at the end of links posted on this page.
If not otherwise explicitly mentioned in the body of the article, at the time of writing, the author has no position in any stock mentioned in this article and no business relationship with any company mentioned. The author has not received compensation for writing this article, other than from FXStreet.
FXStreet and the author do not provide personalized recommendations. The author makes no representations as to the accuracy, completeness, or suitability of this information. FXStreet and the author will not be liable for any errors, omissions or any losses, injuries or damages arising from this information and its display or use. Errors and omissions excepted.
The author and FXStreet are not registered investment advisors and nothing in this article is intended to be investment advice.
Recommended content
Editors’ Picks
EUR/USD stays weak near 1.0700 after German GDP data

EUR/USD is keeping the red near 1.0700 as investors await inflation and growth data for the Eurozone. The data from Germany showed that the GDP contracted at an annual rate of 0.2% in Q1 as expected, not allowing the Euro to attract investors.
GBP/USD remains pressured toward 1.2500 on US Dollar rebound

GBP/USD is extending losses toward 1.2500 in European trading on Tuesday. A cautious risk tone and a decent US Dollar comeback weigh negatively on the pair. The focus now shifts to mid-tier US data amid a data-light UK docket.
Gold price remains depressed near $2,320 amid stronger USD, ahead of US macro data

Gold price (XAU/USD) remains depressed heading into the European session on Tuesday and is currently placed near the lower end of its daily range, just above the $2,320 level.
BNB price risks a 10% drop as Binance founder and ex-CEO Changpeng Zhao eyes Tuesday sentencing
Binance Coin price is dumping, with the one-day chart showing a defined downtrend. While the broader market continues to bleed, things could get worse for BNB price ahead of Binance executive Changpeng Zhao sentencing on Tuesday, April 30.
Data fuels China optimism

China's factory activity has expanded for a second consecutive month, marking the best streak in over a year and fueling optimism for the sustainability of the world's second-largest economy's recovery.