- EUR/USD could test the support at the psychological level of 1.0600.
- The pair could extend losses to November’s low at 1.0516 as Technical analysis suggests a bearish confirmation.
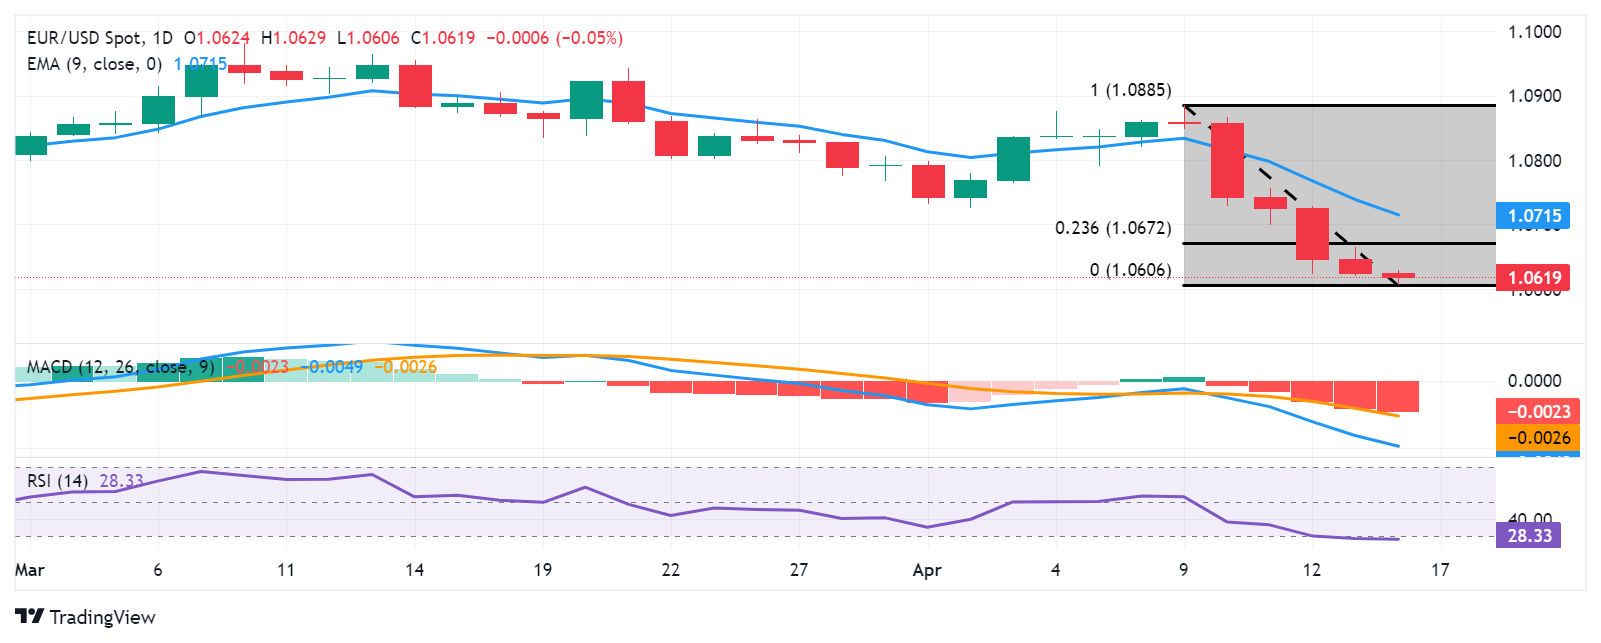
- The area around the major level of 1.0650 and the 23.6% Fibo level of 1.0672 appears as the resistance zone.
EUR/USD continues its losing streak for the sixth successive session on Tuesday, hovering near 1.0620 during the Asian trading hours. The US Dollar's (USD) strength put pressure on the EUR/USD pair, possibly driven by increased US Treasury yields. Additionally, stronger-than-anticipated Retail Sales data from the US has raised expectations that the Federal Reserve (Fed) might prolong its stance on higher interest rates.
On the technical side, the analysis suggests a bearish sentiment for the EUR/USD pair as the 14-day Relative Strength Index (RSI) is positioned below the 50 mark. Additionally, the lagging indicator, Moving Average Convergence Divergence (MACD), lies below the centreline and shows a divergence below the signal line, which indicates weakness for the pair.
The EUR/USD pair could find immediate support around the psychological level of 1.0600. A break below this level could exert downward pressure on the pair to navigate the region around the major level of 1.0550, followed by November’s low at 1.0516.
On the upside, the major level 1.0650 appears as the key barrier, followed by the 23.6% Fibonacci retracement level of 1.0672. A breakthrough above the latter could lead the EUR/USD pair to explore the area around the psychological level of 1.0700 and the nine-day Exponential Moving Average (EMA) at 1.0715.
EUR/USD: Daily Chart
Information on these pages contains forward-looking statements that involve risks and uncertainties. Markets and instruments profiled on this page are for informational purposes only and should not in any way come across as a recommendation to buy or sell in these assets. You should do your own thorough research before making any investment decisions. FXStreet does not in any way guarantee that this information is free from mistakes, errors, or material misstatements. It also does not guarantee that this information is of a timely nature. Investing in Open Markets involves a great deal of risk, including the loss of all or a portion of your investment, as well as emotional distress. All risks, losses and costs associated with investing, including total loss of principal, are your responsibility. The views and opinions expressed in this article are those of the authors and do not necessarily reflect the official policy or position of FXStreet nor its advertisers. The author will not be held responsible for information that is found at the end of links posted on this page.
If not otherwise explicitly mentioned in the body of the article, at the time of writing, the author has no position in any stock mentioned in this article and no business relationship with any company mentioned. The author has not received compensation for writing this article, other than from FXStreet.
FXStreet and the author do not provide personalized recommendations. The author makes no representations as to the accuracy, completeness, or suitability of this information. FXStreet and the author will not be liable for any errors, omissions or any losses, injuries or damages arising from this information and its display or use. Errors and omissions excepted.
The author and FXStreet are not registered investment advisors and nothing in this article is intended to be investment advice.
Recommended content
Editors’ Picks
EUR/USD stays slightly above 1.0700 after mixed US data

EUR/USD lost its traction and turned negative on the day but managed to hold above 1.0700. Although the upbeat Employment Cost Index data boosted the USD earlier in the day, the weak consumer sentiment reading limits the currency's gains.
GBP/USD declines toward 1.2500 on renewed USD strength

GBP/USD turned south and dropped toward 1.2500 in the second half of the day. The US Dollar gathers strength following the strong wage inflation data, forcing the pair to stay on the back foot.
Gold extends daily slide toward $2,300 after US data

Gold stays under bearish pressure and declines toward $2,300 on Tuesday. The benchmark 10-year US Treasury bond yield stays in positive territory above 4.6% after US Employment Cost Index data, weighing on XAU/USD.
XRP hovers above $0.51 as Ripple motion to strike new expert materials receives SEC response

Ripple (XRP) trades broadly sideways on Tuesday after closing above $0.51 on Monday as the payment firm’s legal battle against the US Securities and Exchange Commission (SEC) persists.
Eurozone inflation stable as the outlook on prices gets increasingly muddied

Eurozone headline inflation remains stable at 2.4%. With higher energy prices and improving domestic demand, questions about the direction of inflation become louder.