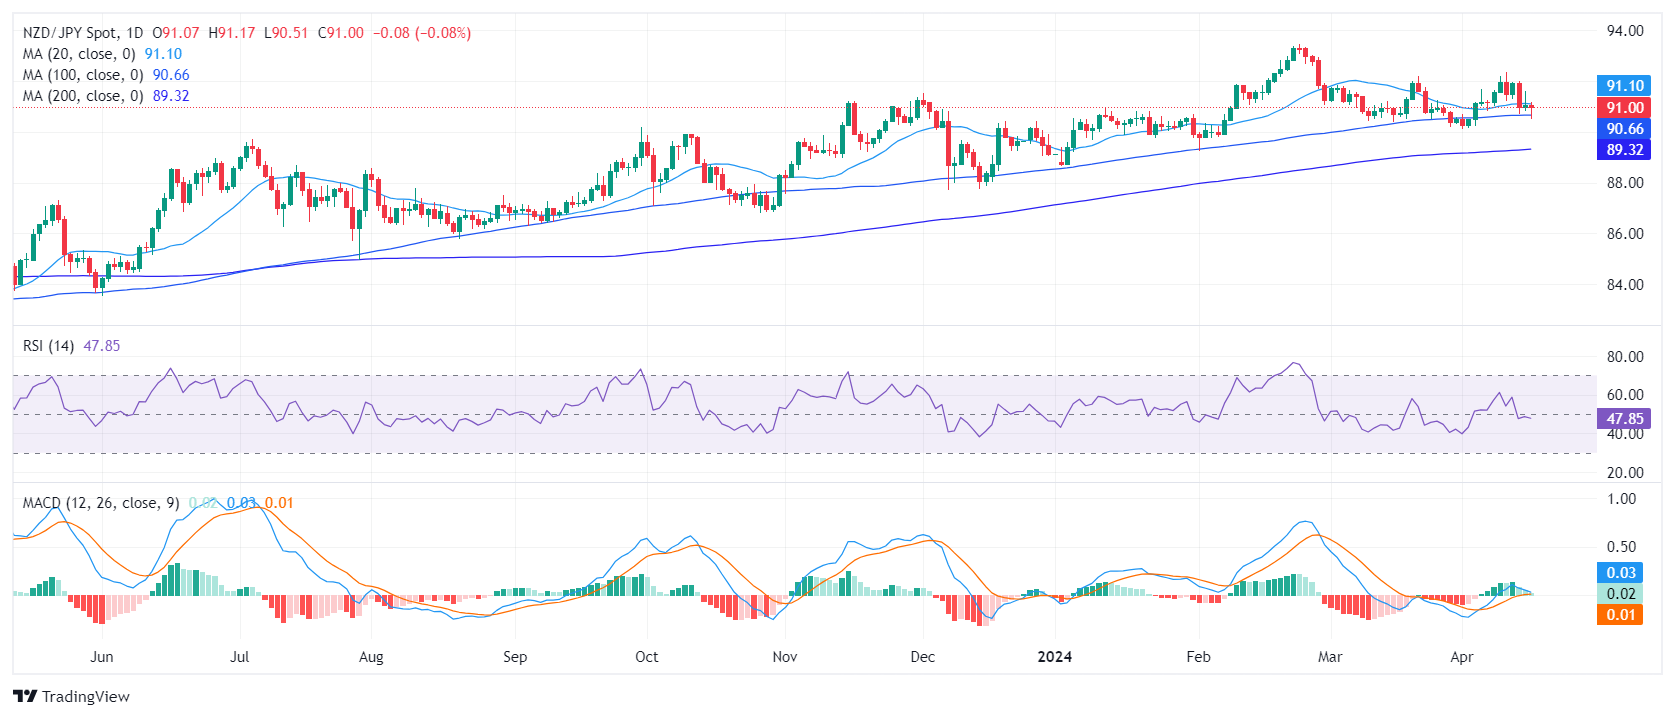
- The daily RSI reveals that market momentum is currently dominated by sellers.
- The daily MACD presents flat green bars, indicating a lack of buying traction.
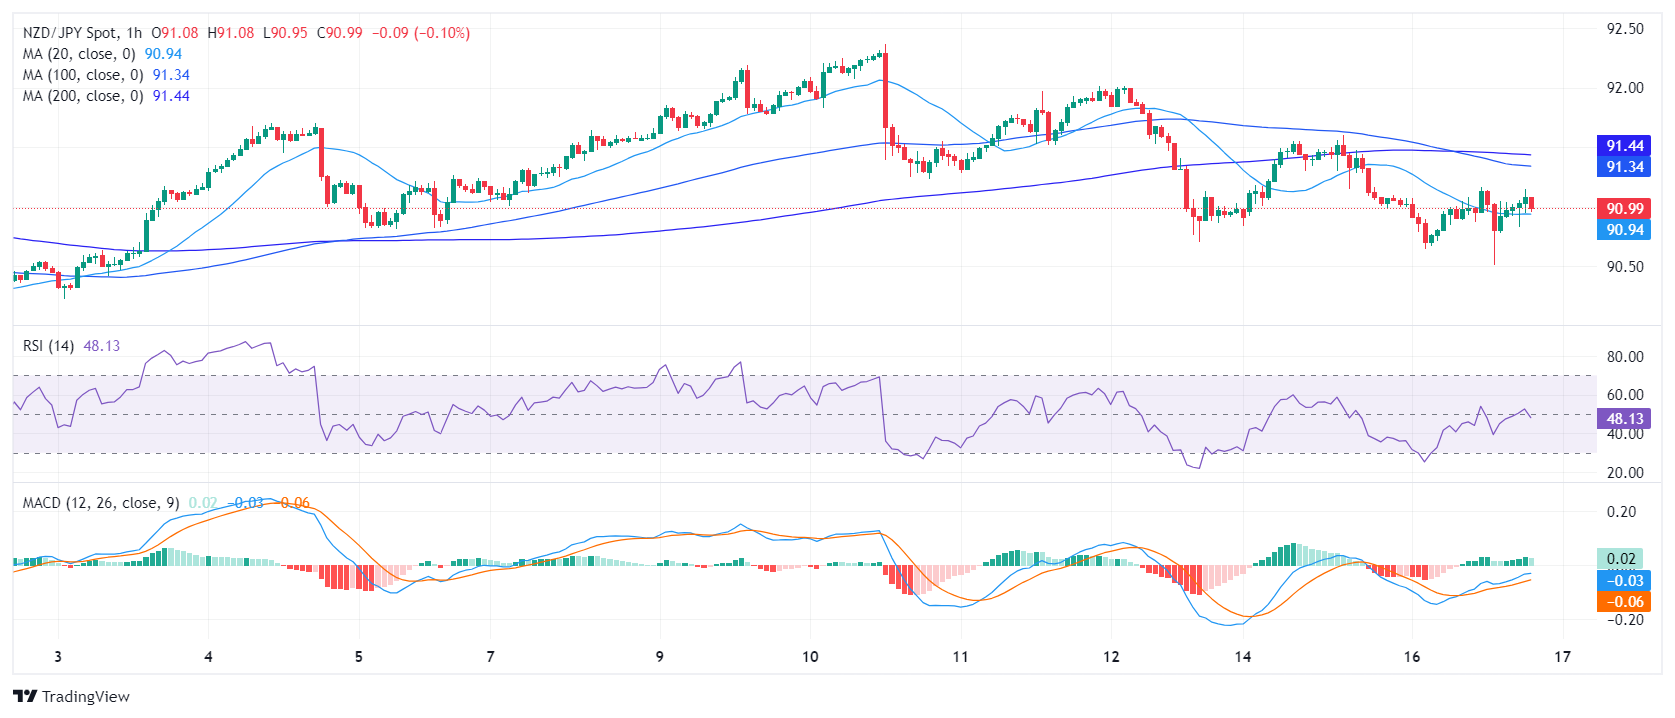
- In the hourly chart, the RSI shows slight improvement, suggesting sellers losing some ground.
The NZD/JPY stabilized at around 90.94 and managed to clear most of its daily losses. However, in the shorter time frames, there are signs of a bullish recovery.
The daily Relative Strength Index (RSI) hovers in the negative territory. The most recent reading fell to 48, reflecting a market momentum currently dominated by sellers. Furthermore, the Moving Average Convergence Divergence (MACD) histogram prints flat green bars, indicating a lack of positive momentum.
NZD/JPY daily chart
Transitioning to the hourly chart, the RSI seems to confirm the tepid sentiment observed on the daily chart. The most recent reading also lands in the 48 range. Nevertheless, signs of slight improvement towards the positive territory appear in the RSI and the latest session reading climbed from a preceding low of 41. Moreover, the MACD histogram on the hourly chart prints green bars, suggesting a possible pick-up in positive momentum.
NZD/JPY hourly chart
The broader outlook, on the other hand, suggests that the bulls control the overall trend, but as long as the buyers fail to reclaim the 20-day Simple Moving Average (SMA), the short-term outlook will remain tilted in favor of the buyers.
Information on these pages contains forward-looking statements that involve risks and uncertainties. Markets and instruments profiled on this page are for informational purposes only and should not in any way come across as a recommendation to buy or sell in these assets. You should do your own thorough research before making any investment decisions. FXStreet does not in any way guarantee that this information is free from mistakes, errors, or material misstatements. It also does not guarantee that this information is of a timely nature. Investing in Open Markets involves a great deal of risk, including the loss of all or a portion of your investment, as well as emotional distress. All risks, losses and costs associated with investing, including total loss of principal, are your responsibility. The views and opinions expressed in this article are those of the authors and do not necessarily reflect the official policy or position of FXStreet nor its advertisers. The author will not be held responsible for information that is found at the end of links posted on this page.
If not otherwise explicitly mentioned in the body of the article, at the time of writing, the author has no position in any stock mentioned in this article and no business relationship with any company mentioned. The author has not received compensation for writing this article, other than from FXStreet.
FXStreet and the author do not provide personalized recommendations. The author makes no representations as to the accuracy, completeness, or suitability of this information. FXStreet and the author will not be liable for any errors, omissions or any losses, injuries or damages arising from this information and its display or use. Errors and omissions excepted.
The author and FXStreet are not registered investment advisors and nothing in this article is intended to be investment advice.
Recommended content
Editors’ Picks
AUD/USD: Gains appear capped near 0.6580

AUD/USD made a sharp U-turn on Tuesday, reversing six consecutive sessions of gains and tumbling to multi-day lows near 0.6480 on the back of the robust bounce in the Greenback.
EUR/USD looks depressed ahead of FOMC

EUR/USD followed the sour mood prevailing in the broader risk complex and plummeted to multi-session lows in the vicinity of 1.0670 in response to the data-driven rebound in the US Dollar prior to the Fed’s interest rate decision.
Gold stable below $2,300 despite mounting fears

Gold stays under selling pressure and confronts the $2,300 region on Tuesday against the backdrop of the resumption of the bullish trend in the Greenback and the decent bounce in US yields prior to the interest rate decision by the Fed on Wednesday.
Bitcoin price tests $60K range as Coinbase advances toward instant, low-cost BTC transfers

BTC bulls need to hold here on the daily time frame, lest we see $52K range tested. Bitcoin (BTC) price slid lower on Tuesday during the opening hours of the New York session, dipping its toes into a crucial chart area.
Federal Reserve meeting preview: The stock market expects the worst

US stocks are a sea of red on Tuesday as a mixture of fundamental data and jitters ahead of the Fed meeting knock risk sentiment. The economic backdrop to this meeting is not ideal for stock market bulls.