- Silver falls pulling back from a daily high of $27.73.
- Technical analysis indicates the uptrend is intact with key support at the $27.05 level, marked by the 50% Fibonacci retracement.
- If silver surpasses the $28.00 resistance, potential targets are $28.48 and possibly year highs near $29.76.
- Conversely, breaking below $27.05 could lead to $26.41 and further declines.
Silver's price dropped 0.79% after hitting a daily high of $27.73, as another inflation report in the United States showed warmer-than-expected inflation. The grey metal failed to capitalize on the fall in US Treasury yields, courtesy of a stronger US Dollar. At the time of writing, the XAG/USD trades at $27.21.
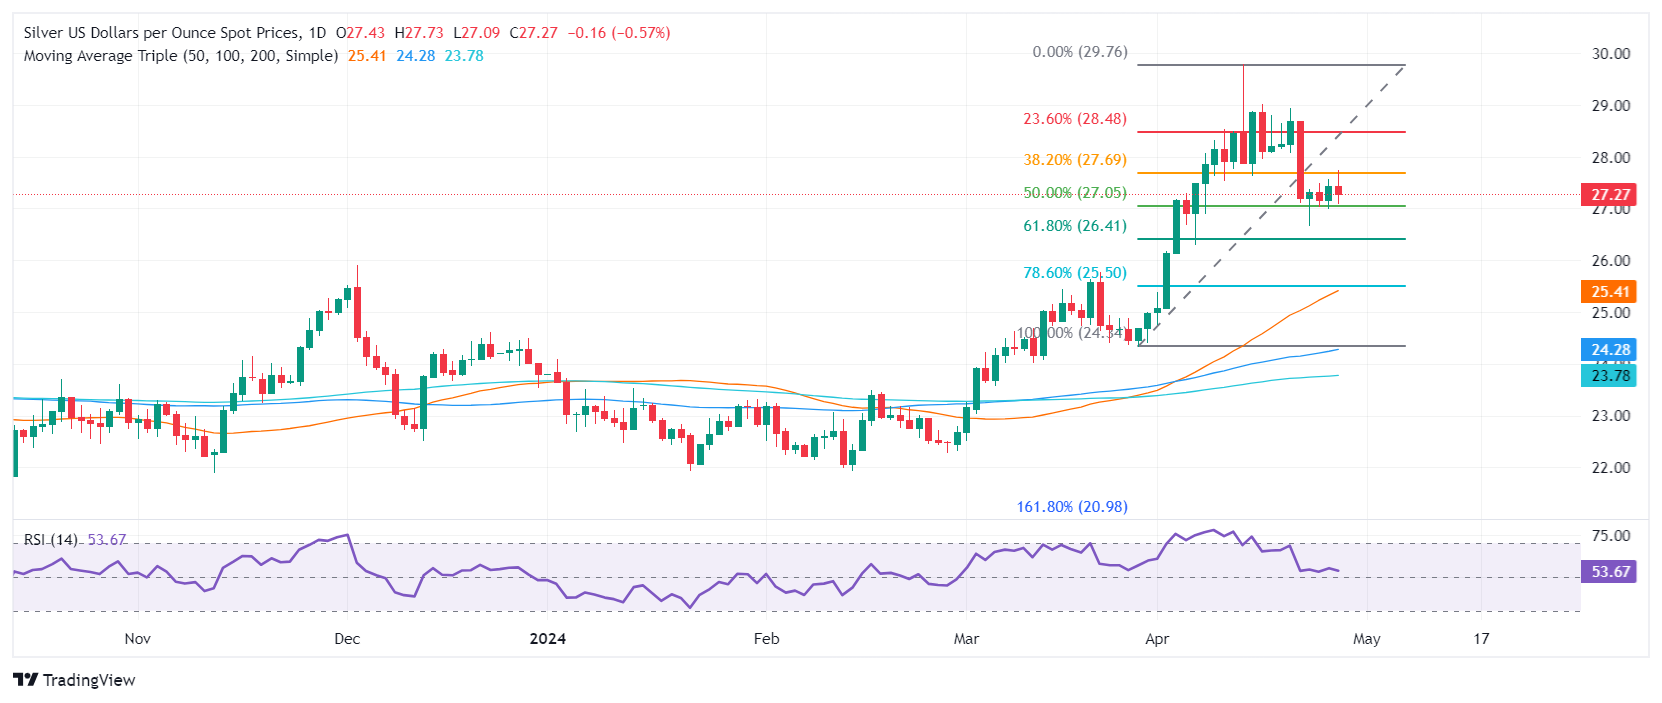
XAG/USD Price Analysis: Technical outlook
Despite retracing, the XAG/USD uptrend is intact, with dips viewed as opportunities for buyers to keep Silver's bid. During the last four trading days, Silver sellers had remained unable to push prices below the 50% Fibonacci retracement at $27.05, of the Fib drawn from the swing low at $24.34 to the latest high at $29.76.
For a bullish resumption, once traders surpass the $28.00 figure, that would pave the way for further upside. The first resistance would be the 23.6% Fib retracement at $28.48, followed by the $29.00 mark. The next supply area would be the year-to-date (YTD) high at $29.76.
On the flip side, bears could find some relief if XAG/USD slides below the 50% Fib retracement at $27.05, followed by the 61.8% retracement at $26.41. A subsequent dip is seen below that level, exposing the confluence of the 50-day moving average (DMA) and the 78.6% Fib retracement at $25.50.
XAG/USD Price Action – Daily Chart
Information on these pages contains forward-looking statements that involve risks and uncertainties. Markets and instruments profiled on this page are for informational purposes only and should not in any way come across as a recommendation to buy or sell in these assets. You should do your own thorough research before making any investment decisions. FXStreet does not in any way guarantee that this information is free from mistakes, errors, or material misstatements. It also does not guarantee that this information is of a timely nature. Investing in Open Markets involves a great deal of risk, including the loss of all or a portion of your investment, as well as emotional distress. All risks, losses and costs associated with investing, including total loss of principal, are your responsibility. The views and opinions expressed in this article are those of the authors and do not necessarily reflect the official policy or position of FXStreet nor its advertisers. The author will not be held responsible for information that is found at the end of links posted on this page.
If not otherwise explicitly mentioned in the body of the article, at the time of writing, the author has no position in any stock mentioned in this article and no business relationship with any company mentioned. The author has not received compensation for writing this article, other than from FXStreet.
FXStreet and the author do not provide personalized recommendations. The author makes no representations as to the accuracy, completeness, or suitability of this information. FXStreet and the author will not be liable for any errors, omissions or any losses, injuries or damages arising from this information and its display or use. Errors and omissions excepted.
The author and FXStreet are not registered investment advisors and nothing in this article is intended to be investment advice.
Recommended content
Editors’ Picks
EUR/USD retreats to 1.0750, eyes on Fedspeak

EUR/USD stays under modest bearish pressure and trades at around 1.0750 on Wednesday. Hawkish comments from Fed officials help the US Dollar stay resilient and don't allow the pair to stage a rebound.
GBP/USD struggles to hold above 1.2500 ahead of Thursday's BoE event

GBP/USD stays on the back foot and trades in negative territory below 1.2500 after losing nearly 0.5% on Tuesday. The renewed US Dollar strength on hawkish Fed comments weighs on the pair as market focus shifts to the BoE's policy announcements on Thursday.
Gold fluctuates in narrow range above $2,300

Gold struggles to make a decisive move in either direction and moves sideways in a narrow channel above $2,300. The benchmark 10-year US Treasury bond yield clings to modest gains near 4.5% and limits XAU/USD's upside.
SEC vs. Ripple lawsuit sees redacted filing go public, XRP dips to $0.51

Ripple (XRP) dipped to $0.51 low on Wednesday, erasing its gains from earlier this week. The Securities and Exchange Commission (SEC) filing is now public, in its redacted version.
Softer growth, cooler inflation and rate cuts remain on the horizon

Economic growth in the US appears to be in solid shape. Although real GDP growth came in well below consensus expectations, the headline miss was mostly the result of larger-than-anticipated drags from trade and inventories.