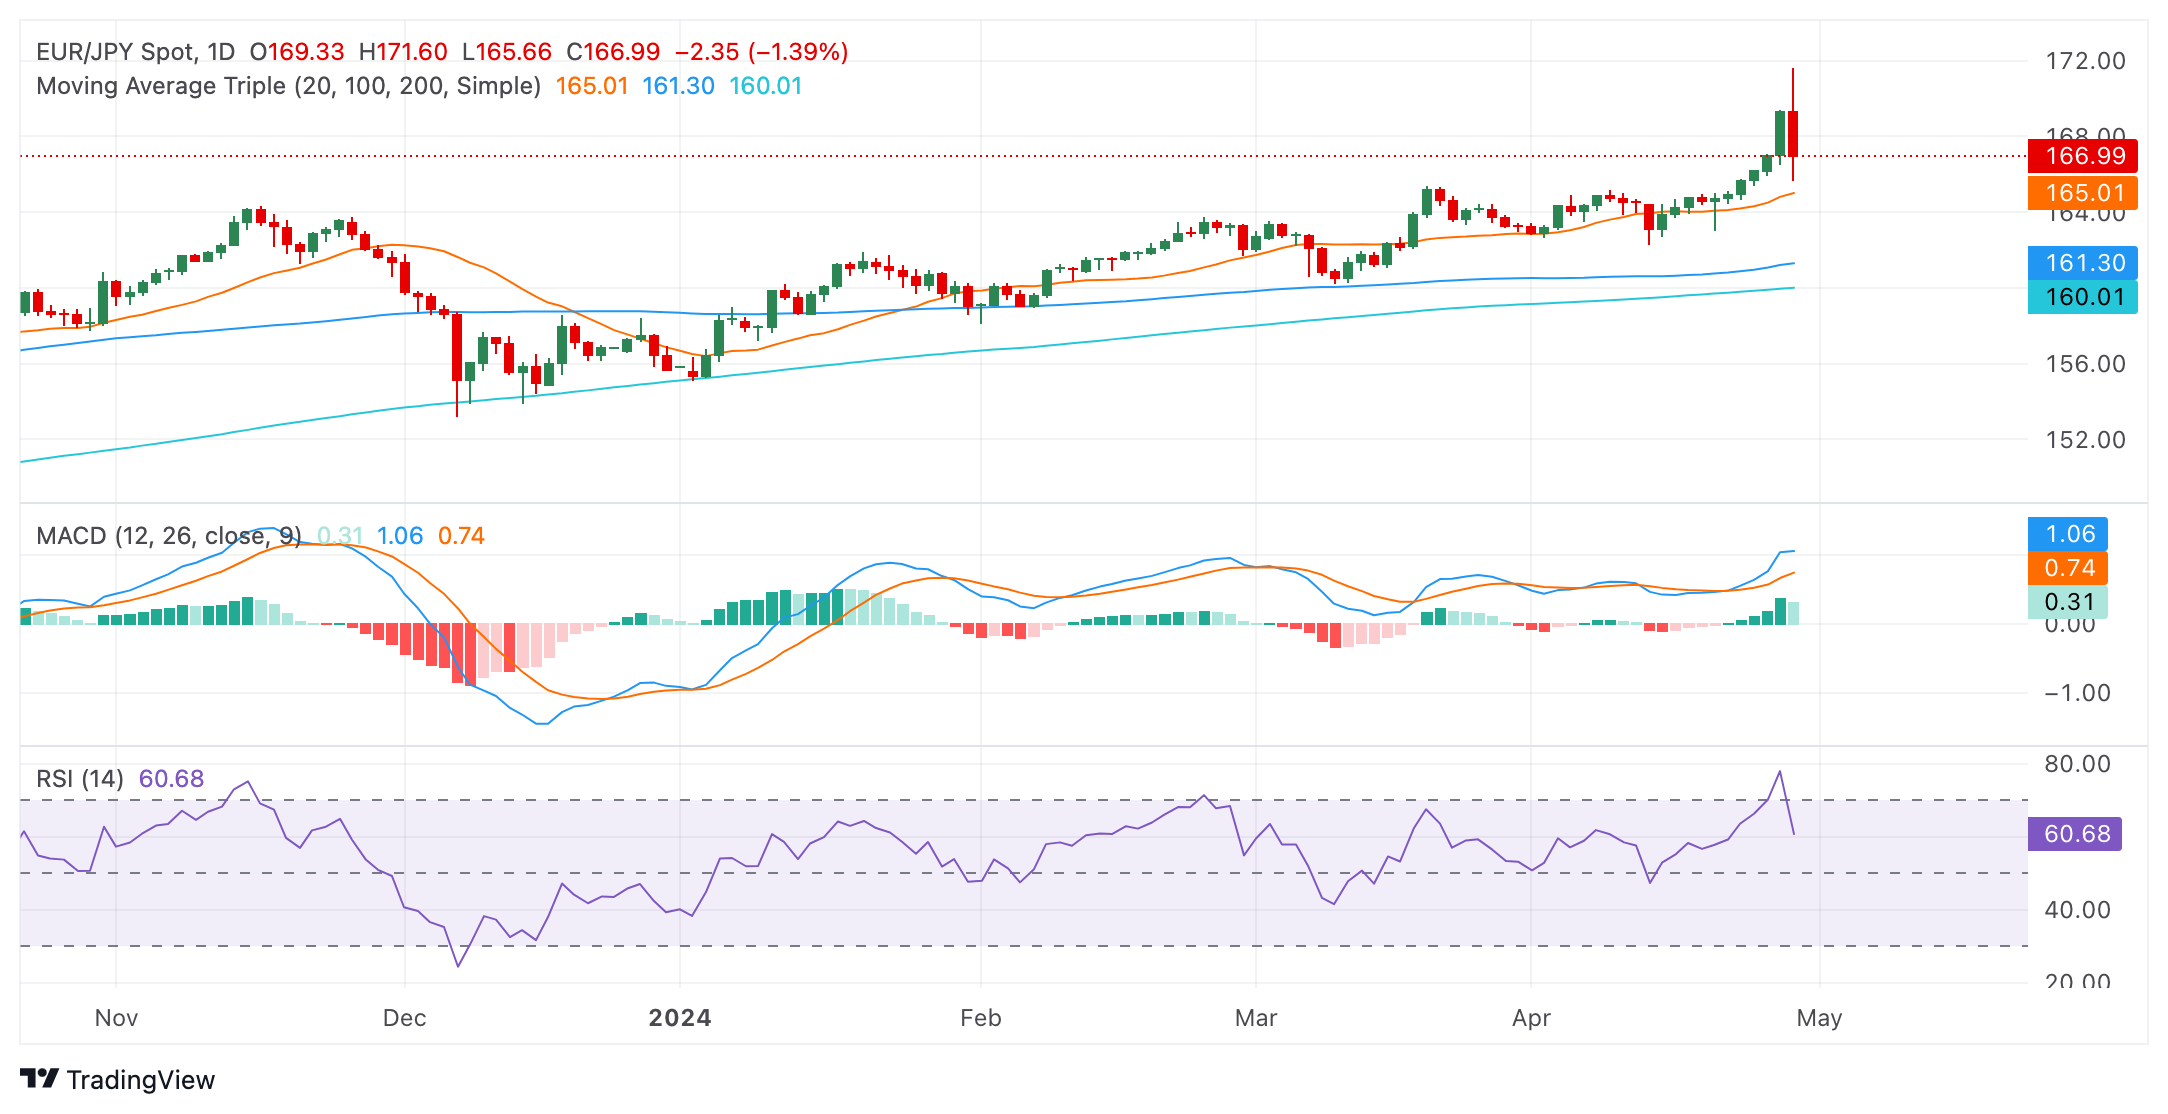
- The daily RSI of the EUR/JPY transitioned from its overbought threshold to near 60.
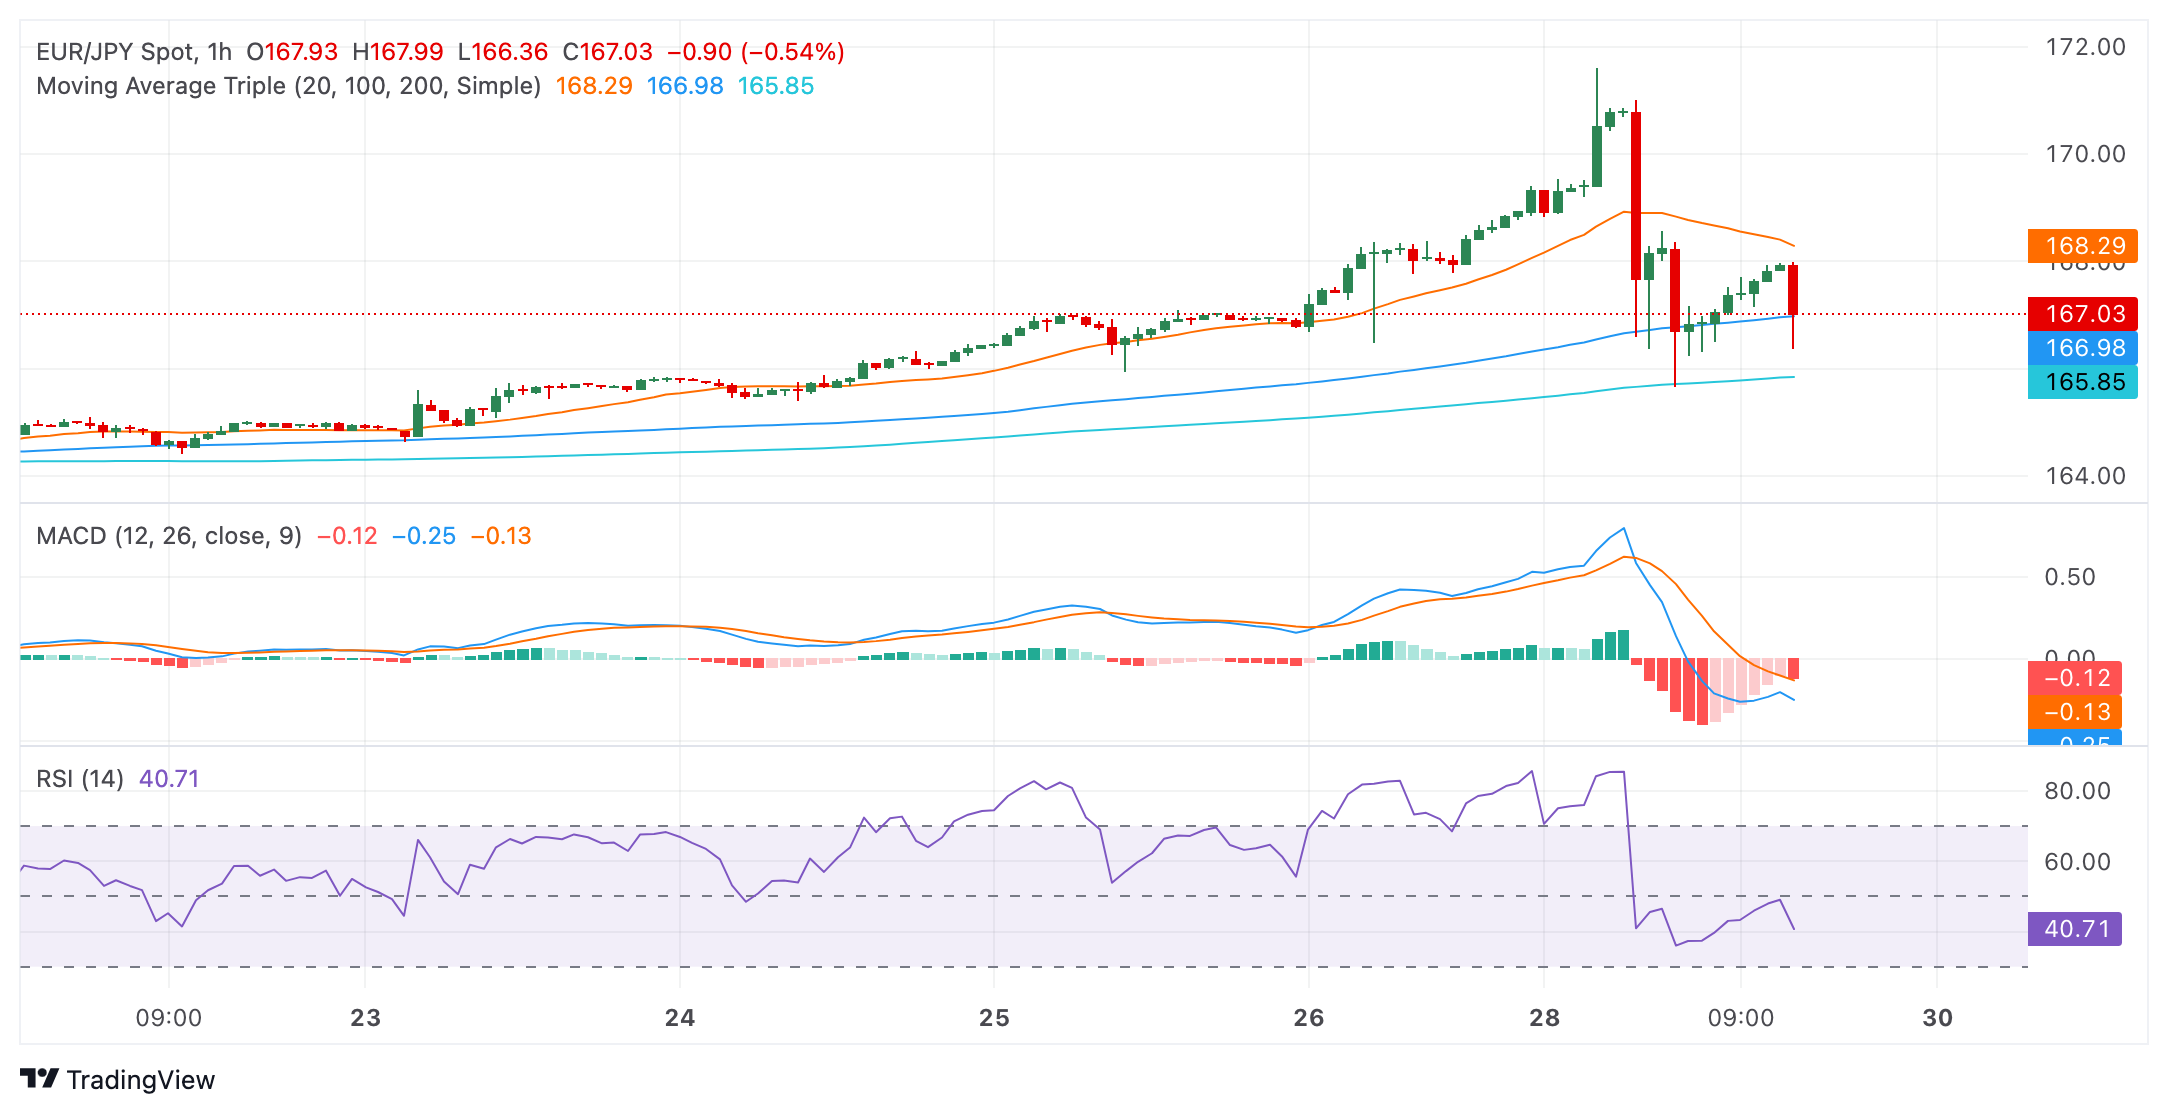
- In the hourly chart, the RSI reveals intense short-term bearish momentum, with the MACD also depicting increased negative bias.
- Any move below the primary SMAs could alter the bullish trend.
The EUR/JPY pair demonstrates resilience, bouncing back after encountering stern resistance at around the pivotal 165.50 landmark. Having faced a downward momentum of 0.90%, the pair skillfully remains above key Simple Moving Averages (SMAs), underlining the persistent bullish sentiment. Yet, market participants are encouraged to prepare for potential short-term adjustments, as bears are gaining ground.
On the daily chart, the Relative Strength Index (RSI) took a big hit on Monday. Notwithstanding, the current value remains in the positive trend territory, potentially signaling the continuation of buying momentum. The Moving Average Convergence Divergence (MACD) prints decreasing green bars, suggesting that the tide might have turned in favor of the bears.
EUR/JPY daily chart
Turning to the hourly RSI, it is located in the negative territory. This situation highlights possible downward momentum, aligning with the downward trend depicted on the Moving Average Convergence Divergence (MACD) histogram, currently showing rising red bars, denoting strengthened negative momentum.
EUR/JPY hourly chart
Broadening the perspective, the EUR/JPY pair is positioned above the 20-day Simple Moving Average (SMA), having just bounced back strongly after meeting resistance at the crucial 165.50 level. This event furnishes a positive impression of the short-term trend. Additionally, the pair's placement above the 100 and 200-day SMA suggests an overall bullish long-term outlook. However, buyers shouldn’t call it a victory as bears are still around the corner.
Information on these pages contains forward-looking statements that involve risks and uncertainties. Markets and instruments profiled on this page are for informational purposes only and should not in any way come across as a recommendation to buy or sell in these assets. You should do your own thorough research before making any investment decisions. FXStreet does not in any way guarantee that this information is free from mistakes, errors, or material misstatements. It also does not guarantee that this information is of a timely nature. Investing in Open Markets involves a great deal of risk, including the loss of all or a portion of your investment, as well as emotional distress. All risks, losses and costs associated with investing, including total loss of principal, are your responsibility. The views and opinions expressed in this article are those of the authors and do not necessarily reflect the official policy or position of FXStreet nor its advertisers. The author will not be held responsible for information that is found at the end of links posted on this page.
If not otherwise explicitly mentioned in the body of the article, at the time of writing, the author has no position in any stock mentioned in this article and no business relationship with any company mentioned. The author has not received compensation for writing this article, other than from FXStreet.
FXStreet and the author do not provide personalized recommendations. The author makes no representations as to the accuracy, completeness, or suitability of this information. FXStreet and the author will not be liable for any errors, omissions or any losses, injuries or damages arising from this information and its display or use. Errors and omissions excepted.
The author and FXStreet are not registered investment advisors and nothing in this article is intended to be investment advice.
Recommended content
Editors’ Picks
EUR/USD fluctuates near 1.0850 as markets assess Fed commentary

EUR/USD trades in a tight range at around 1.0850 on Tuesday. In the absence of high-tier data releases, the cautious market mood helps the USD hold its ground and limits the pair's upside. Meanwhile, investors continue to scrutinize comments from central bank officials.
GBP/USD stays in positive territory above 1.2700, awaits fresh catalysts

GBP/USD struggles to stretch higher above 1.2700 on Tuesday as the mixed action in Wall Street supports the USD. Investors await fresh catalysts, with several Fed officials and BoE Governor Bailey set to speak later in the session.
Gold steadies around $2,420 ahead of FOMC Minutes

Gold gained traction and climbed to $2,430 area in the American session, turning positive on the day. The pullback in the benchmark 10-year US Treasury bond yield helps XAU/USD stage a rebound following the sharp retreat seen from the all-time high set at the weekly opening at $2,450.
Shiba Inu price flashes buy signal, 25% rally likely Premium
Shiba Inu price has flipped bullish to the tune of the crypto market and breached key hurdles, showing signs of a potential rally. Investors looking to accumulate SHIB have a good opportunity to do so before the meme coin shoots up.
Three fundamentals for the week: UK inflation, Fed minutes and Flash PMIs stand out Premium

Sell in May and go away? That market adage seems outdated in the face of new highs for stocks and Gold. Optimism depends on the easing from central banks – and some clues are due this week.