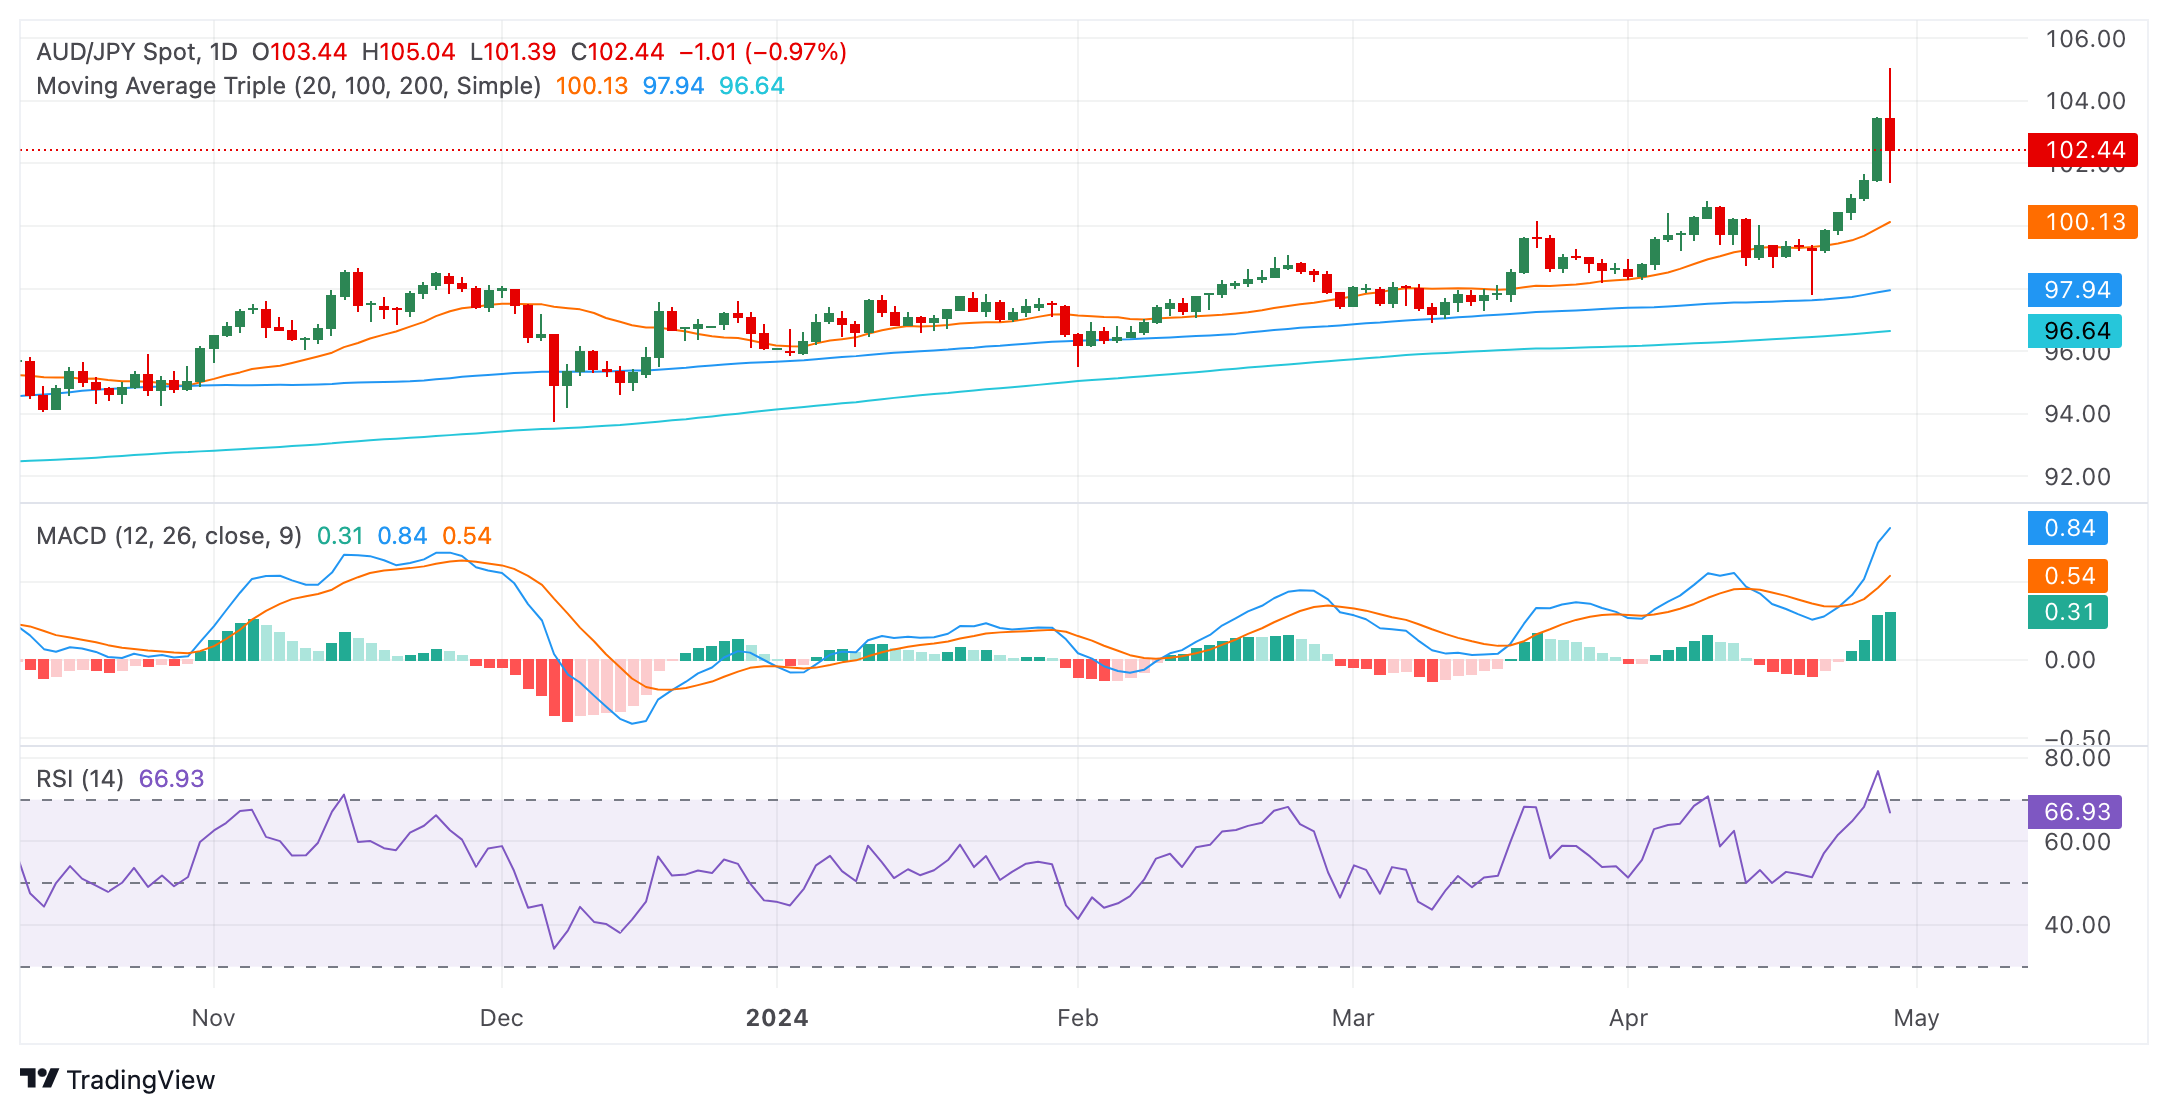
- The daily RSI suggests consistent buying momentum, with a slight dip indicating the possibility of a short-term correction.
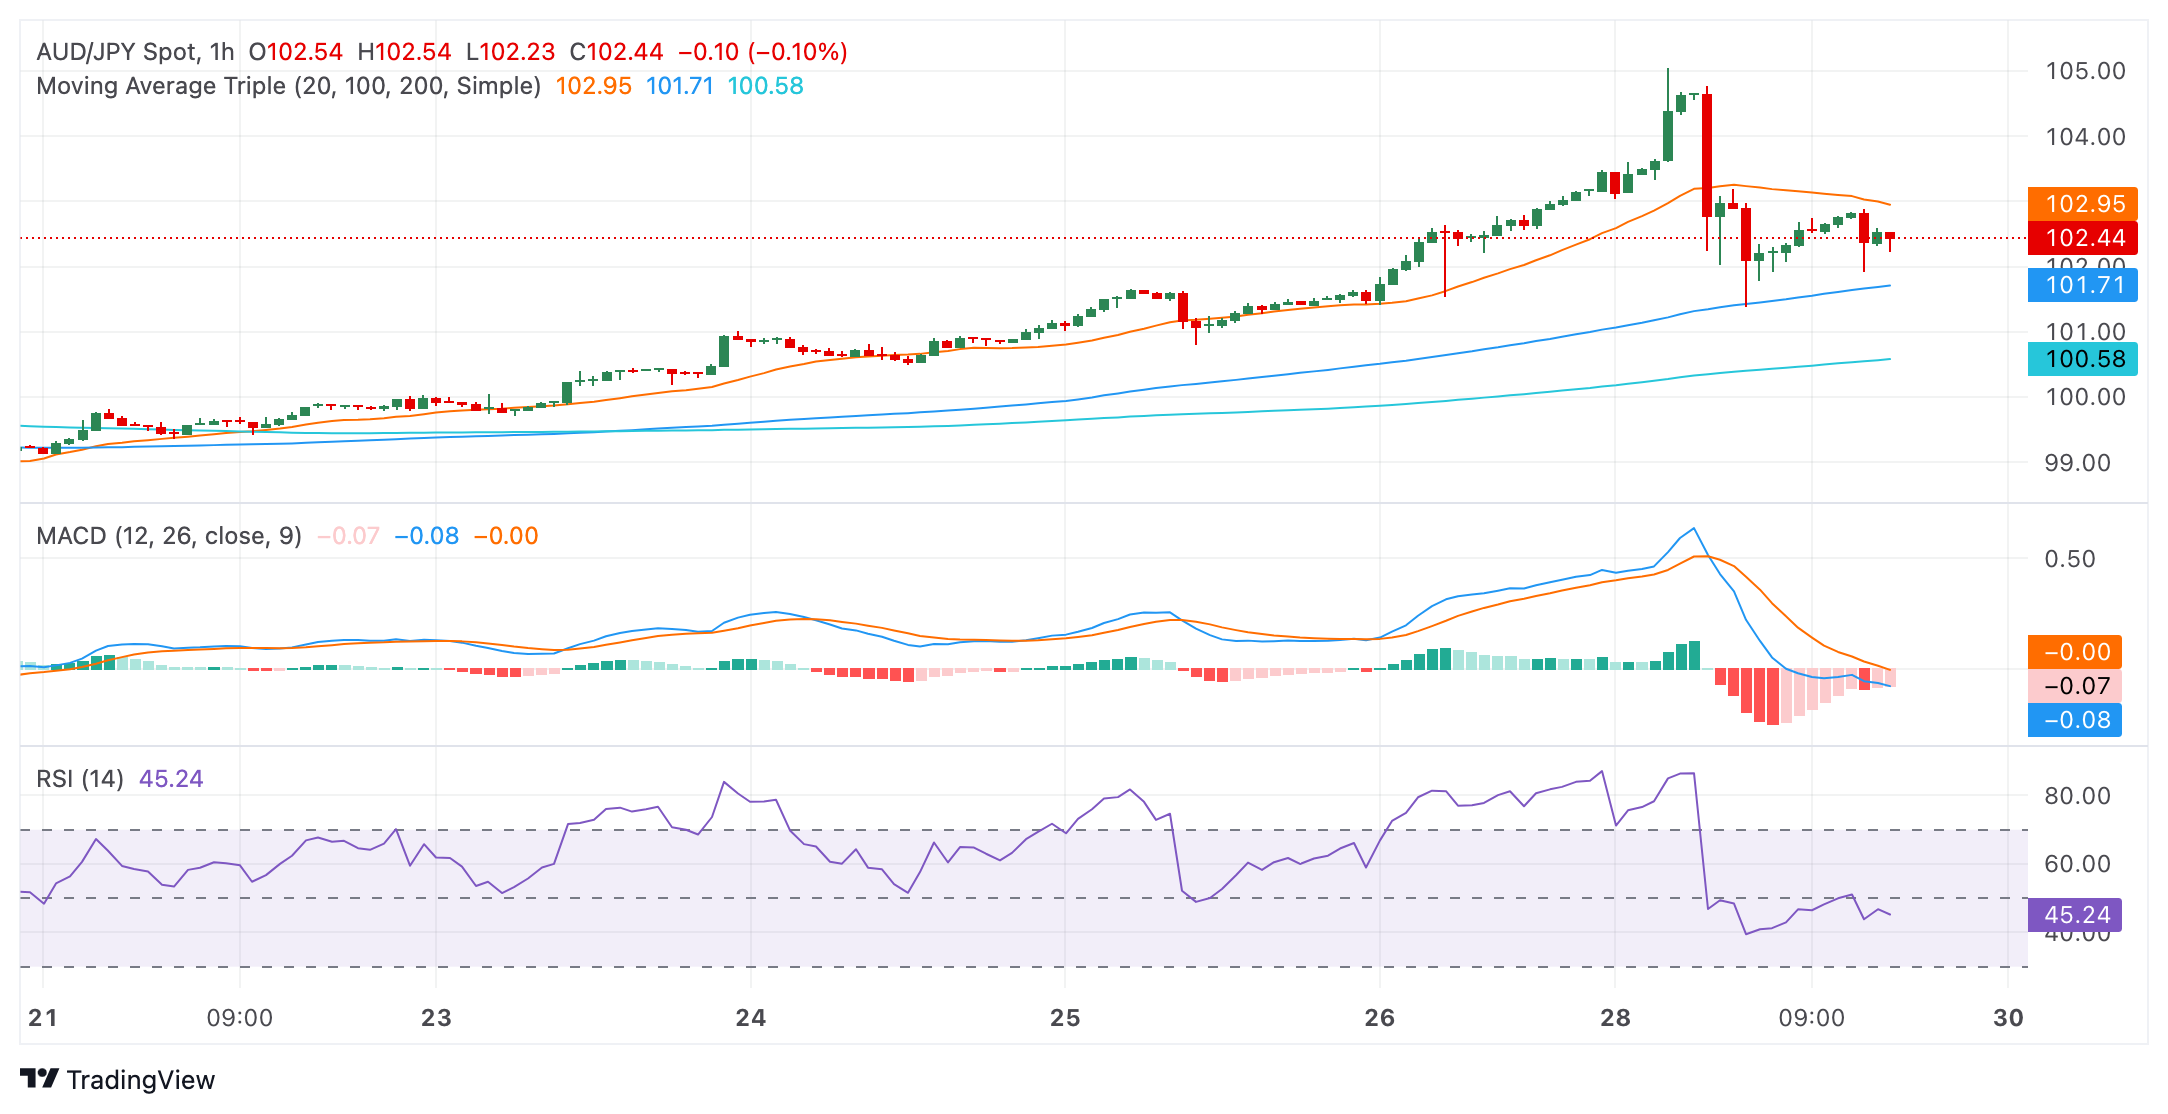
- The hourly RSI and MACD readings suggest mounting selling pressure in recent transactions.
The AUD/JPY trades at 102.43, demonstrating a pronounced bullish inclination despite Monday’s sharp losses. Indicators took a big hit and suggests that despite the bullish command, sellers are gaining ground.
On the daily chart, the Relative Strength Index (RSI) is seen trending within the overbought terrain, suggesting that buying activity has dominated the market action. A recent dip from overbought territory to 66 indicates potential for a short-term correction in the upcoming sessions. Meanwhile, the Moving Average Convergence Divergence (MACD) maintains flat green bars, signifying stable positive momentum.
AUD/JPY daily chart
Shifting to the hourly chart, the RSI readings reveal a contrasting scenario. The hourly RSI readings are trending in the negative territory, demonstrating that selling activity had a certain control in the latest trading hours. Moreover, the hourly MACD marks flat red bars, underlining a steady negative momentum.
AUD/JPY hourly chart
Observing the broader perspective, the AUD/JPY currently occupies a position above the 20, 100, and 200-day SMA. This stance underscores the prevailing bullish market sentiment in both short-term and long-term scenarios. In conclusion, while the daily indicators reflect an overall bullish sentiment, recent hourly readings suggest the potential for a short-term correction. Traders should monitor these contrasting signals closely as there might be a shift in the momentum in favor of the sellers and they might reclaim the 20-day SMA.
Information on these pages contains forward-looking statements that involve risks and uncertainties. Markets and instruments profiled on this page are for informational purposes only and should not in any way come across as a recommendation to buy or sell in these assets. You should do your own thorough research before making any investment decisions. FXStreet does not in any way guarantee that this information is free from mistakes, errors, or material misstatements. It also does not guarantee that this information is of a timely nature. Investing in Open Markets involves a great deal of risk, including the loss of all or a portion of your investment, as well as emotional distress. All risks, losses and costs associated with investing, including total loss of principal, are your responsibility. The views and opinions expressed in this article are those of the authors and do not necessarily reflect the official policy or position of FXStreet nor its advertisers. The author will not be held responsible for information that is found at the end of links posted on this page.
If not otherwise explicitly mentioned in the body of the article, at the time of writing, the author has no position in any stock mentioned in this article and no business relationship with any company mentioned. The author has not received compensation for writing this article, other than from FXStreet.
FXStreet and the author do not provide personalized recommendations. The author makes no representations as to the accuracy, completeness, or suitability of this information. FXStreet and the author will not be liable for any errors, omissions or any losses, injuries or damages arising from this information and its display or use. Errors and omissions excepted.
The author and FXStreet are not registered investment advisors and nothing in this article is intended to be investment advice.
Recommended content
Editors’ Picks
AUD/USD trades around 0.6660 after another uneventful session

The AUD/USD pair remained away from investors’ radar and holds on to familiar levels in the 0.6660 region. Australian calendar has nothing to offer on Wednesday, but the RBNZ monetary policy decision may spur action.
EUR/USD lacks directional strength, hovers around 1.0850

The EUR/USD pair extended its consolidative phase for the second consecutive day as financial markets missed a clear catalyst. Attention flips to the FOMC Meeting Minutes scheduled for mid-Wednesday.
Gold steadies around $2,420 ahead of FOMC Minutes

Gold gained traction and climbed to $2,430 area in the American session, turning positive on the day. The pullback in the benchmark 10-year US Treasury bond yield helps XAU/USD stage a rebound following the sharp retreat seen from the all-time high set at the weekly opening at $2,450.
Ethereum could see new all-time high following Fidelity and Grayscale updates on ETF application

Ethereum (ETH) continued its rally on Tuesday following filings on the Securities & Exchange Commission's (SEC) website showing Fidelity and Grayscale filed an amended S-1 registration and initial 19b-4, respectively, for their spot ETH ETF products.
UK: Due in large part to the base effect, CPI is forecast down to 2.1% from 3.2%

Another handful of Fed speakers. As we saw yesterday, the latest stance is “not yet.” In the UK, tomorrow we get CPI. Due in large part to the base effect, CPI is forecast down to 2.1% from 3.2% and core, to 3.6% from 5.2%.