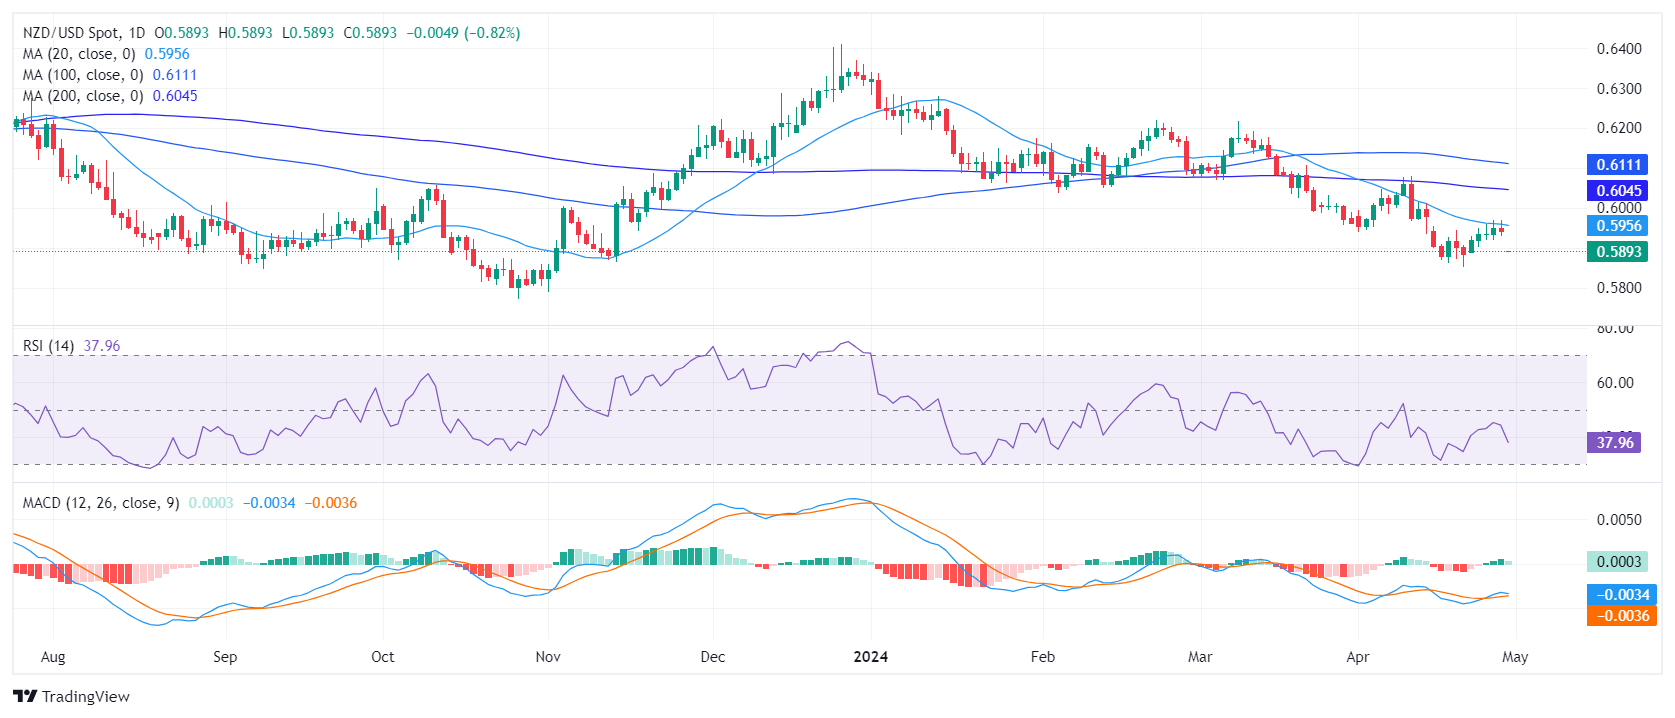
- The daily indicators of the NZD/USD daily chart confirm a steady bearish momentum.
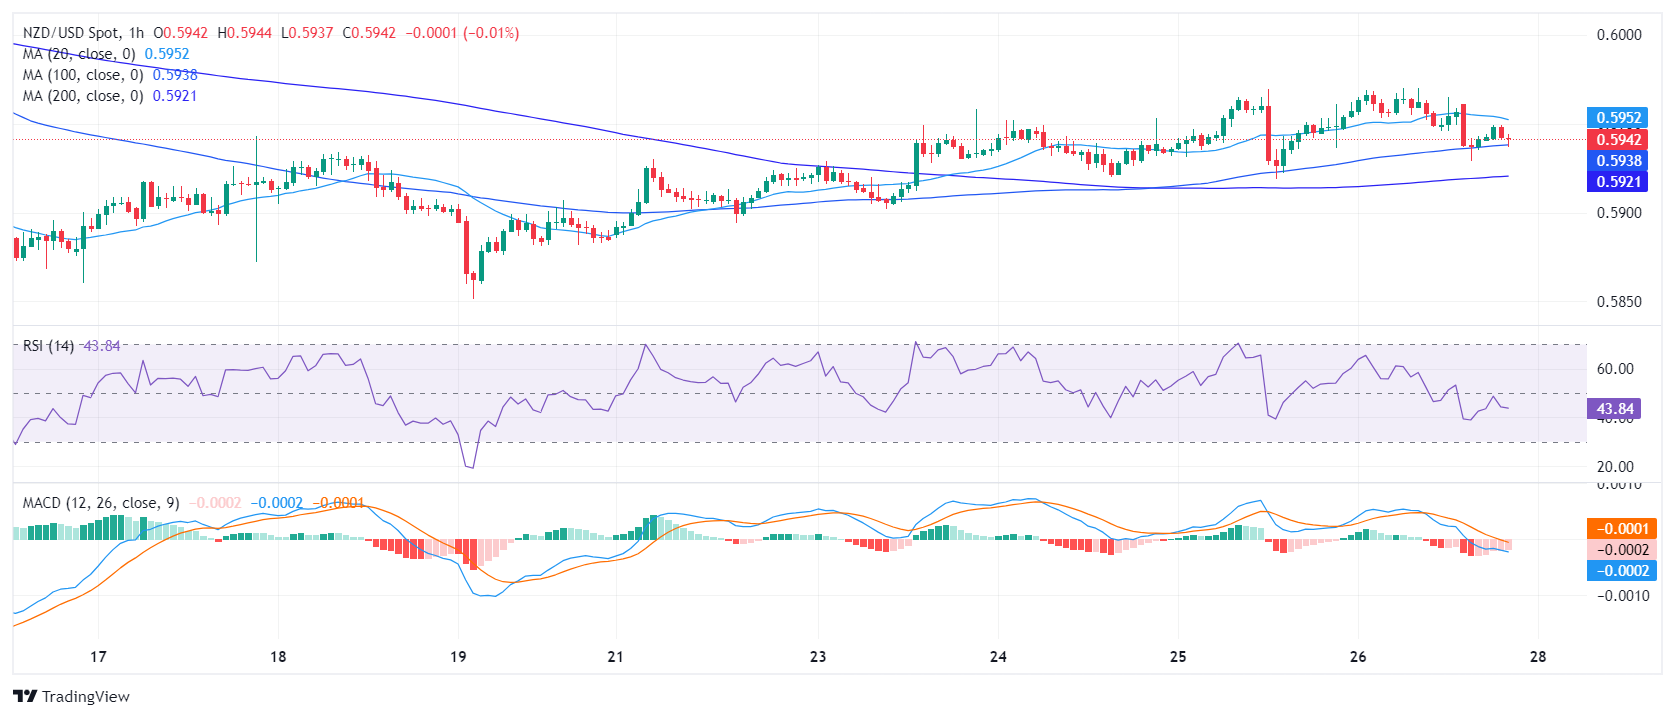
- Hourly indicators signal oversold conditions which could lead to a mild upwards correction.
- The failure to regain the 20-day SMA worsens the outlook of the buyers.
The NZD/USD pair plunged to 0.5890 on Tuesday as bears hit the gas and bulls seem to have given up their momentum gained in the last session. Selling conditions are more extreme in the hourly charts as indicators signal oversold conditions which could lead to an upwards correction in the near tearm.
The daily Relative Strength Index (RSI) for the NZD/USD is in the negative territory. The most recent reading signals sellers are currently dominating the market, with a downward trend. Regarding the Moving Average Convergence Divergence (MACD), the decreasing green bars confirm this bearish momentum with the bullish impulse nowhere to be found.
NZD/USD daily chart
On the hourly chart, the RSI shows stronger oversold conditions in the most recent hours. However, the hourly MACD, indicated by flat red bars on the histogram, shows a flattening bearish momentum. Notably, despite the oversold condition, buyers have not yet stepped in with enough strength to shift the momentum toward the green zone but they might in the next hours.
NZD/USD hourly chart
Regarding the larger scope, the NZD/USD displays a bearish trend, evidenced by its position below the Simple Moving Averages (SMA) for the 20, 100, and 200-day periods. After getting rejected by the 20-day SMA multiple times in the last sessions, the outlook is confirmed to be bearish as the time of the buyers seems to be fading. In addition, after failing to conquer that crucial resistance, leaves the pair bound for additional downside. However, ahead of the Asian session, there could be a minor upward correction to consolidate the overextended downward movements seen on the hourly chart.
Information on these pages contains forward-looking statements that involve risks and uncertainties. Markets and instruments profiled on this page are for informational purposes only and should not in any way come across as a recommendation to buy or sell in these assets. You should do your own thorough research before making any investment decisions. FXStreet does not in any way guarantee that this information is free from mistakes, errors, or material misstatements. It also does not guarantee that this information is of a timely nature. Investing in Open Markets involves a great deal of risk, including the loss of all or a portion of your investment, as well as emotional distress. All risks, losses and costs associated with investing, including total loss of principal, are your responsibility. The views and opinions expressed in this article are those of the authors and do not necessarily reflect the official policy or position of FXStreet nor its advertisers. The author will not be held responsible for information that is found at the end of links posted on this page.
If not otherwise explicitly mentioned in the body of the article, at the time of writing, the author has no position in any stock mentioned in this article and no business relationship with any company mentioned. The author has not received compensation for writing this article, other than from FXStreet.
FXStreet and the author do not provide personalized recommendations. The author makes no representations as to the accuracy, completeness, or suitability of this information. FXStreet and the author will not be liable for any errors, omissions or any losses, injuries or damages arising from this information and its display or use. Errors and omissions excepted.
The author and FXStreet are not registered investment advisors and nothing in this article is intended to be investment advice.
Recommended content
Editors’ Picks
AUD/USD trades around 0.6660 after another uneventful session

The AUD/USD pair remained away from investors’ radar and holds on to familiar levels in the 0.6660 region. Australian calendar has nothing to offer on Wednesday, but the RBNZ monetary policy decision may spur action.
EUR/USD lacks directional strength, hovers around 1.0850

The EUR/USD pair extended its consolidative phase for the second consecutive day as financial markets missed a clear catalyst. Attention flips to the FOMC Meeting Minutes scheduled for mid-Wednesday.
Gold steadies around $2,420 ahead of FOMC Minutes

Gold gained traction and climbed to $2,430 area in the American session, turning positive on the day. The pullback in the benchmark 10-year US Treasury bond yield helps XAU/USD stage a rebound following the sharp retreat seen from the all-time high set at the weekly opening at $2,450.
Ethereum could see new all-time high following Fidelity and Grayscale updates on ETF application

Ethereum (ETH) continued its rally on Tuesday following filings on the Securities & Exchange Commission's (SEC) website showing Fidelity and Grayscale filed an amended S-1 registration and initial 19b-4, respectively, for their spot ETH ETF products.
UK: Due in large part to the base effect, CPI is forecast down to 2.1% from 3.2%

Another handful of Fed speakers. As we saw yesterday, the latest stance is “not yet.” In the UK, tomorrow we get CPI. Due in large part to the base effect, CPI is forecast down to 2.1% from 3.2% and core, to 3.6% from 5.2%.