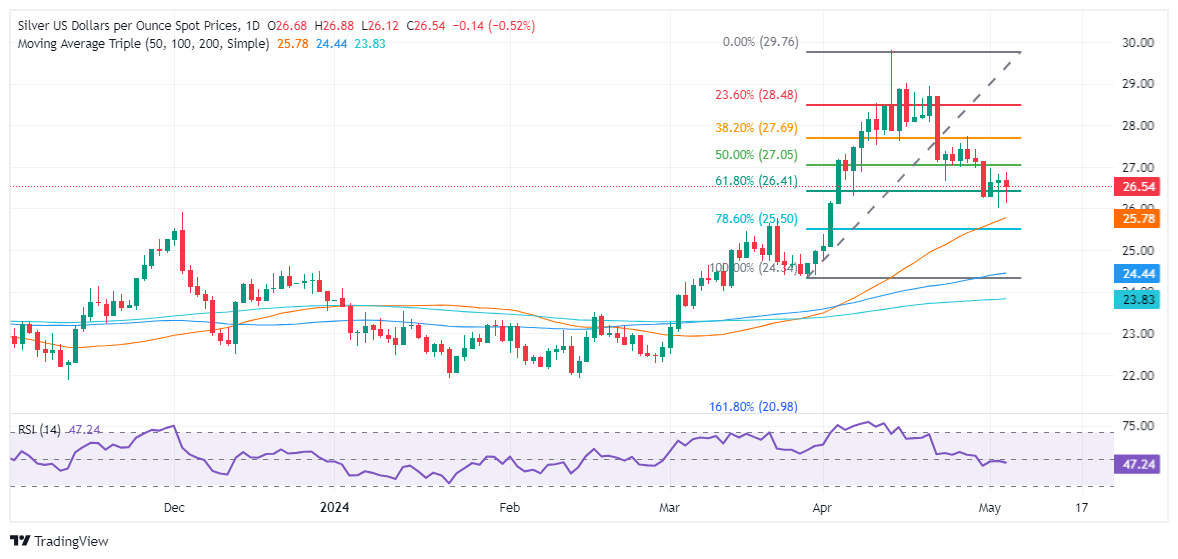
- Silver dips to $26.54, down 0.43%; 'dragonfly doji' hints at possible uptrend.
- Finds support at 61.8% Fibonacci level ($26.41); crossing $27.00 could boost bullish momentum.
- Downside risk if below May 2 low of $26.02, aiming for 50-day MA at $25.79.
Silver price uptrend continued during the week despite registering losses of around 2.40%. Nevertheless, May 2’s price action forming a ‘dragonfly doji,’ a bullish candle, alongside technical indicators suggesting that the grey metal remains bullish, could pave the way for a recovery. At the time of writing, XAG/USD trades at $26.54, down 0.43%.
XAG/USD Price Analysis: Technical outlook
As previously mentioned, Silver remains bullishly biased after posting an impressive rally that passed the $29.00 mark. It appears to have bottomed out at around the 61.8% Fibonacci retracement at $26.41, though buyers had been unable to test the $27.00 mark.
Although momentum had shifted bearishly, with the Relative Strength Index (RSI) diving below the 50-midline, upside risks remain. If buyers reclaim the $27.00 figure, that could reignite buying pressure and pave the way to challenge the next resistance level seen at the 38.2% Fibo retracement at $27.70. Once surpassed, the next step would be the 23.6% Fibo retracement at $28.49.
Nevertheless, with the RSI standing at bearish territory, sellers need to push prices below the May 2 low of $26.02. Once cleared the next stop would be the 50-day moving average (DMA) at $25.79, followed by the 78.6% Fibo retracement at $25.50.
XAU/USD Price Action – Daily Chart
Information on these pages contains forward-looking statements that involve risks and uncertainties. Markets and instruments profiled on this page are for informational purposes only and should not in any way come across as a recommendation to buy or sell in these assets. You should do your own thorough research before making any investment decisions. FXStreet does not in any way guarantee that this information is free from mistakes, errors, or material misstatements. It also does not guarantee that this information is of a timely nature. Investing in Open Markets involves a great deal of risk, including the loss of all or a portion of your investment, as well as emotional distress. All risks, losses and costs associated with investing, including total loss of principal, are your responsibility. The views and opinions expressed in this article are those of the authors and do not necessarily reflect the official policy or position of FXStreet nor its advertisers. The author will not be held responsible for information that is found at the end of links posted on this page.
If not otherwise explicitly mentioned in the body of the article, at the time of writing, the author has no position in any stock mentioned in this article and no business relationship with any company mentioned. The author has not received compensation for writing this article, other than from FXStreet.
FXStreet and the author do not provide personalized recommendations. The author makes no representations as to the accuracy, completeness, or suitability of this information. FXStreet and the author will not be liable for any errors, omissions or any losses, injuries or damages arising from this information and its display or use. Errors and omissions excepted.
The author and FXStreet are not registered investment advisors and nothing in this article is intended to be investment advice.
Recommended content
Editors’ Picks
EUR/USD retreats toward 1.0850 on modest USD recovery

EUR/USD stays under modest bearish pressure and trades in negative territory at around 1.0850 after closing modestly lower on Thursday. In the absence of macroeconomic data releases, investors will continue to pay close attention to comments from Federal Reserve officials.
GBP/USD holds above 1.2650 following earlier decline

GBP/USD edges higher after falling to a daily low below 1.2650 in the European session on Friday. The US Dollar holds its ground following the selloff seen after April inflation data and makes it difficult for the pair to extend its rebound. Fed policymakers are scheduled to speak later in the day.
Gold climbs to multi-week highs above $2,400

Gold gathered bullish momentum and touched its highest level in nearly a month above $2,400. Although the benchmark 10-year US yield holds steady at around 4.4%, the cautious market stance supports XAU/USD heading into the weekend.
Chainlink social dominance hits six-month peak as LINK extends gains
-637336005550289133_XtraSmall.jpg)
Chainlink (LINK) social dominance increased sharply on Friday, exceeding levels seen in the past six months, along with the token’s price rally that started on Wednesday.
Week ahead: Flash PMIs, UK and Japan CPIs in focus – RBNZ to hold rates

After cool US CPI, attention shifts to UK and Japanese inflation. Flash PMIs will be watched too amid signs of a rebound in Europe. Fed to stay in the spotlight as plethora of speakers, minutes on tap.