
Gold’s Breaks Below $1,270 – Third Time Lucky?
The last couple of years and – in particular – the last couple of months were very difficult for gold traders – i.e. they were boring. Despite several huge daily price swings, the precious metals market has not been going anywhere, moving in and around the $1,100 - $1,300 price range. Gold got to the point where this lack of volatility is by itself an extreme sign pointing to a much bigger price swing in the market, as the periods of very high and very low volatility tend to follow each other. Gold seems to have once again topped after moving to a long-term resistance line and the previous highs. Will the upcoming decline be any different than the previous local downswings that were simply followed by yet another rally up to $1,300?
This time could really be different and in the following paragraphs we explain why. Let’s start with gold’s long-term chart (charts courtesy of http://stockcharts.com).
(Click on image to enlarge)
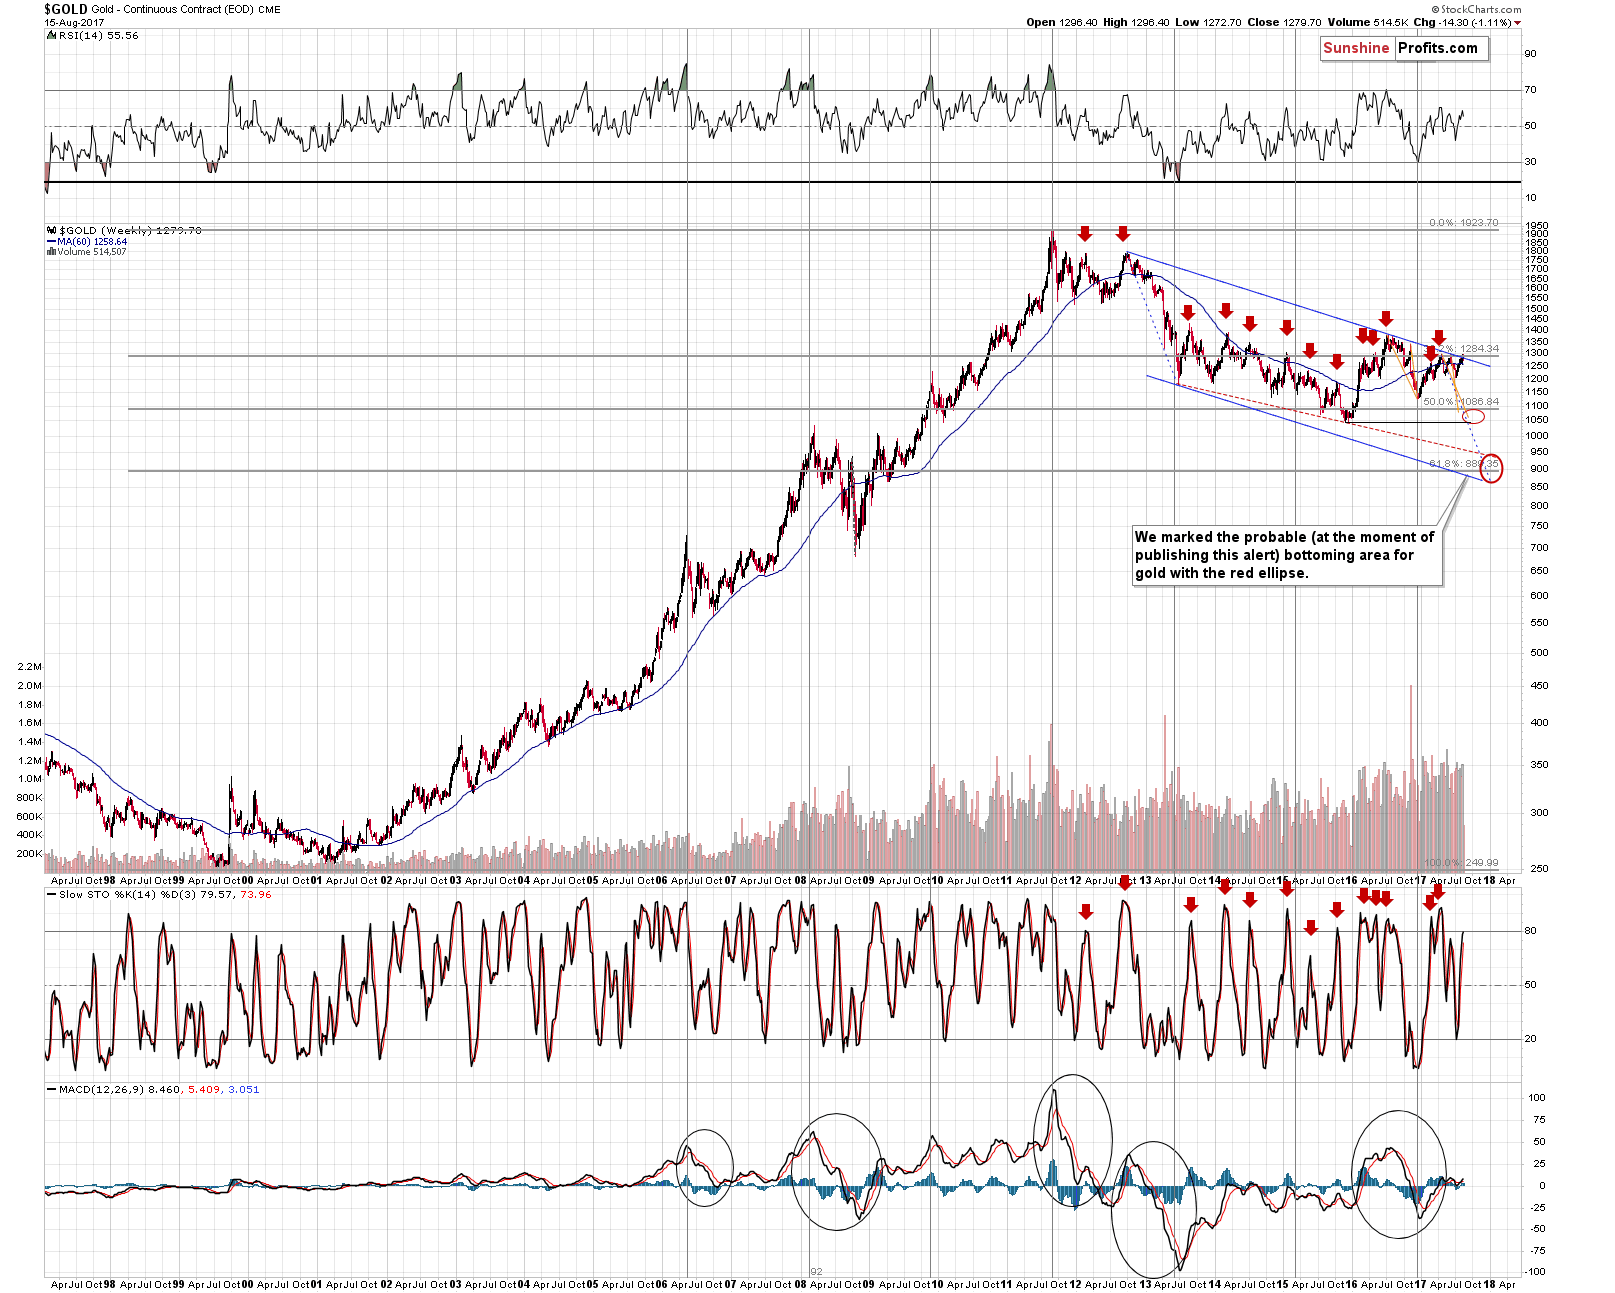
The resistance line is based on the 2012 and 2016 tops. Since both of them are very important from the long-term point of view, the resistance line is also very important. This line, along with the previous 2017 tops seems to have stopped the rally – at the moment of writing these words, gold is back below $1,270.
You can see the proximity of the previous tops more clearly on the short-term chart.
(Click on image to enlarge)
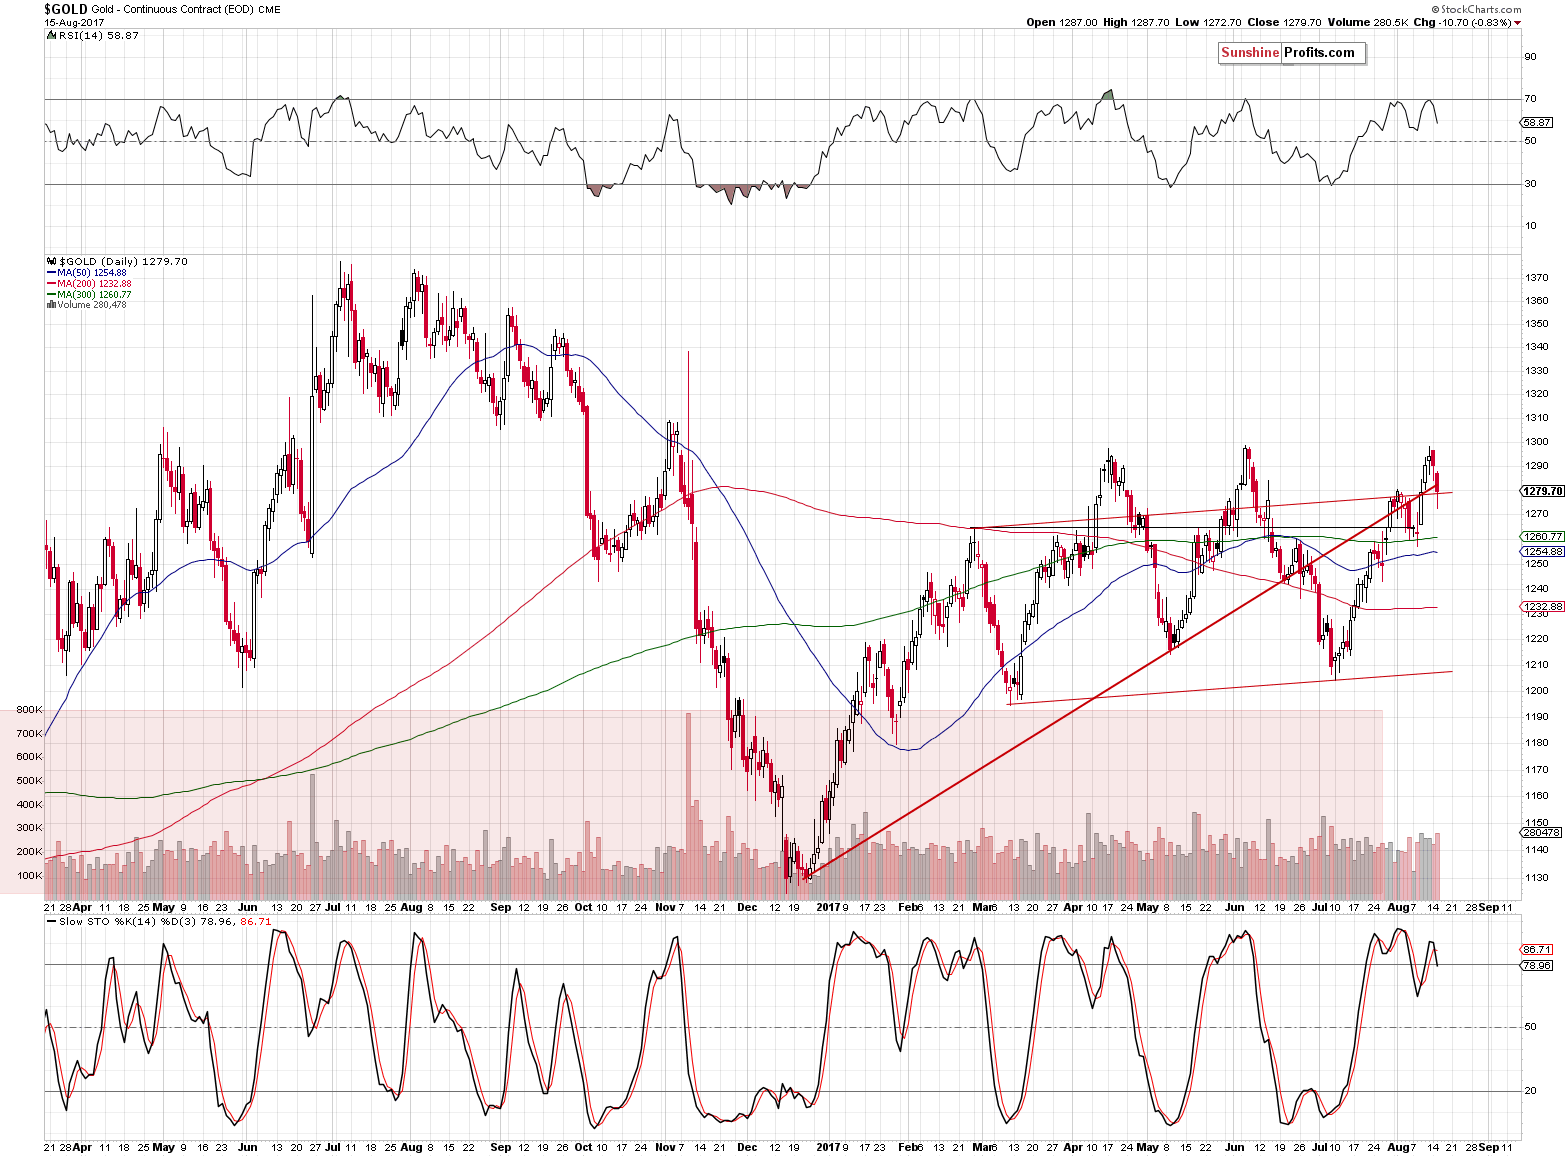
As discussed above, gold is currently a few dollars below the $1,270 level, which means that the yellow metal moved back below the rising red support line, the early August high and that the April and June highs were likely successful in stopping the rally.
The bearish outlook is further confirmed by the RSI indicator – the gold RSI was just at the 70 level which is a classic sell signal – gold’s tops followed quite often after such readings. The same goes for the sell signal from the Stochastic indicator – the latter moved below its red signal line, which is a classic confirmation of a top.
(Click on image to enlarge)
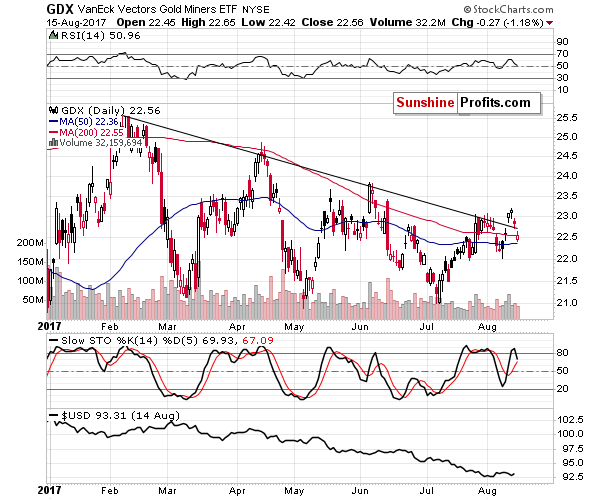
Based on yesterday’s session, we have seen a new important sell signal for the following weeks – the invalidation of a small breakout in the case of mining stocks (the GDX ETF serves as a proxy here).
Miners gave gold bulls false hope for a sustainable rally, but the bullish implications are all gone based on yesterday’s invalidation – in fact, the invalidation by itself serves as a strong sell signal.
Increased geopolitical tensions regarding North Korea were the likely reason for the small breakout in the first place. As we explained numerous times, the impact of geopolitical tensions on gold is rarely a lasting factor – things usually get back to the normal course of action relatively soon. This seems to have been the case one more time and the fact that miners were not able to hold the gains despite a good reason to do so (after all, nuclear tensions are a rather important issue), shows that the market is not ready to move higher.
What we have written so far today has important bearish implications for the following weeks, but it doesn’t say anything regarding the size of the decline. In particular, the above doesn’t indicate whether this time the decline will be able to take gold below the 2017, 2016, and – ultimately – the 2015 lows.
Still, exactly this kind of decline might have just begun.
(Click on image to enlarge)
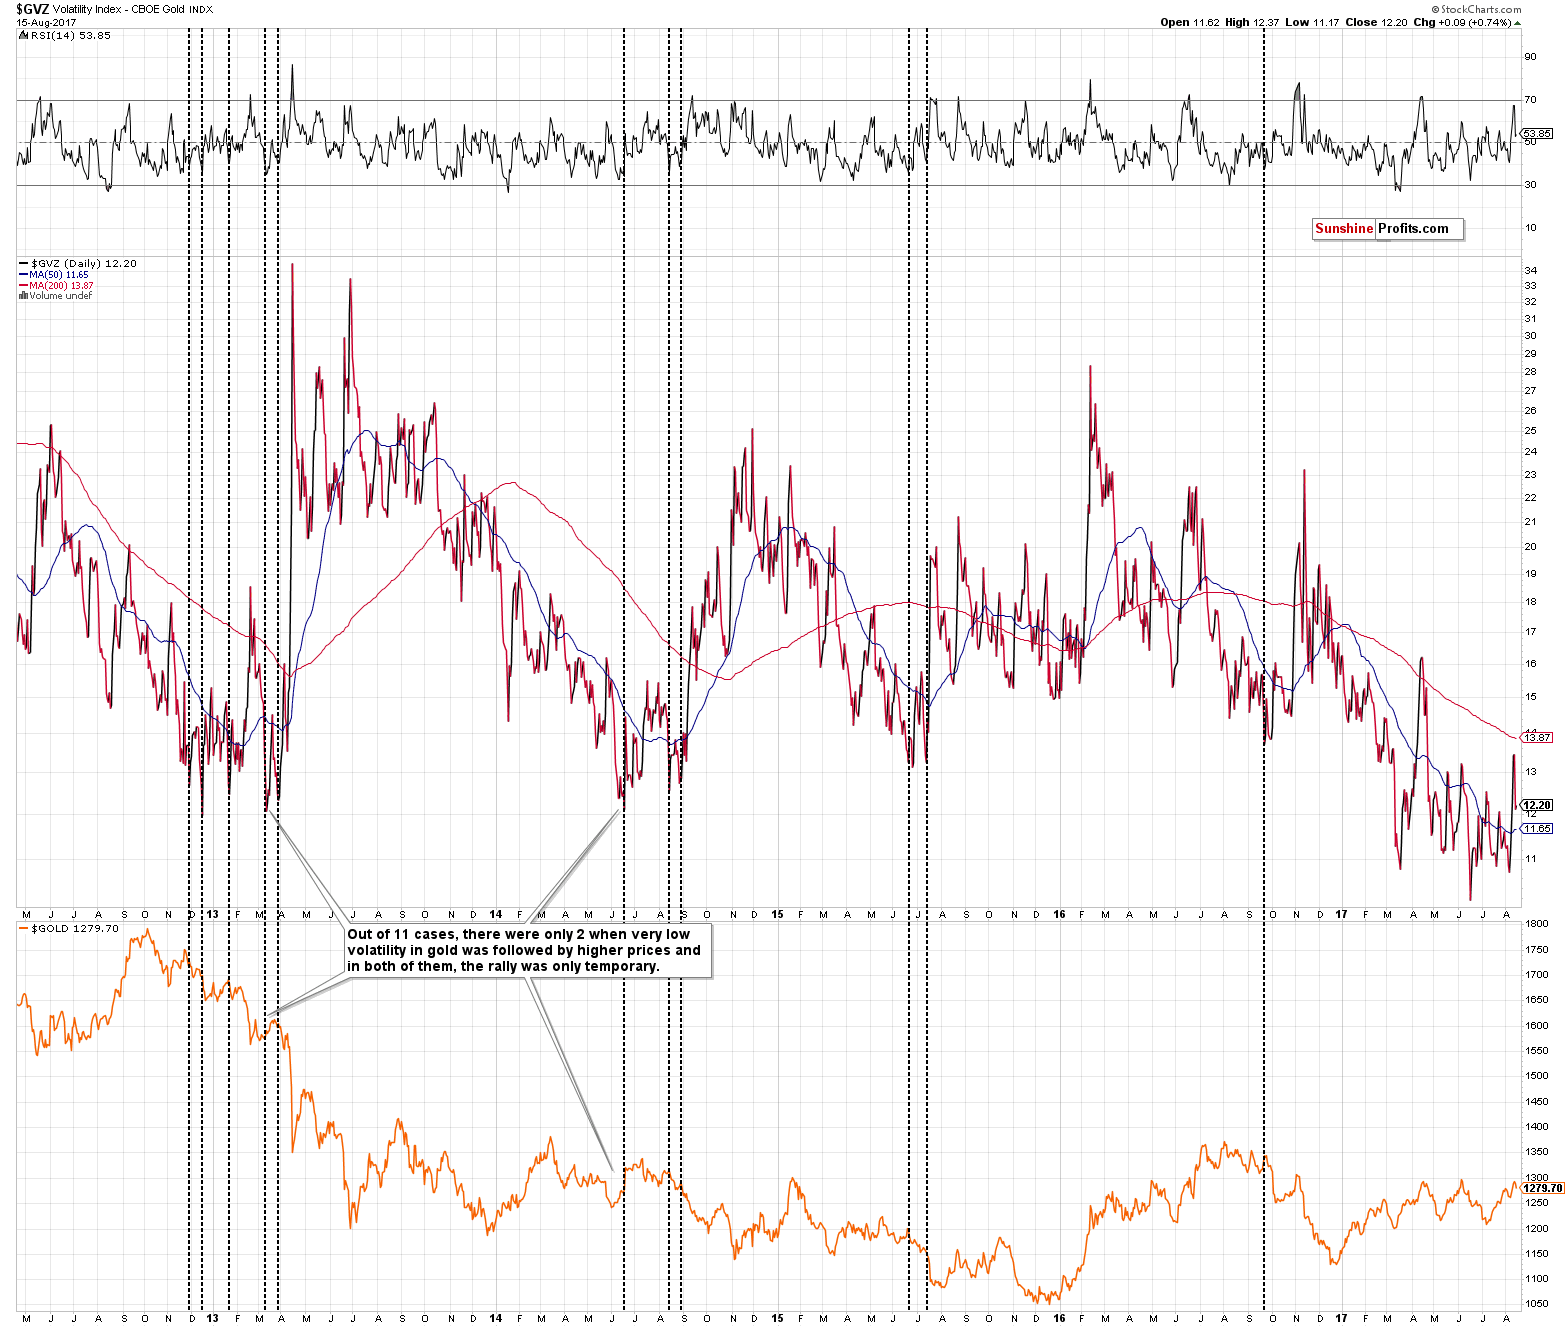
The above chart shows gold’s volatility. Putting aside the very recent upswing, it’s been trading below the previous years’ lows, which is another way of saying that the gold market has not been this boring in a long time. This is not something that should make you give up on it, but rather something that should make you pay extra attention to gold’s actions as what we’ve been seeing recently is quite likely the calm before the storm.
The chart below shows a bigger history of the same phenomenon.
(Click on image to enlarge)
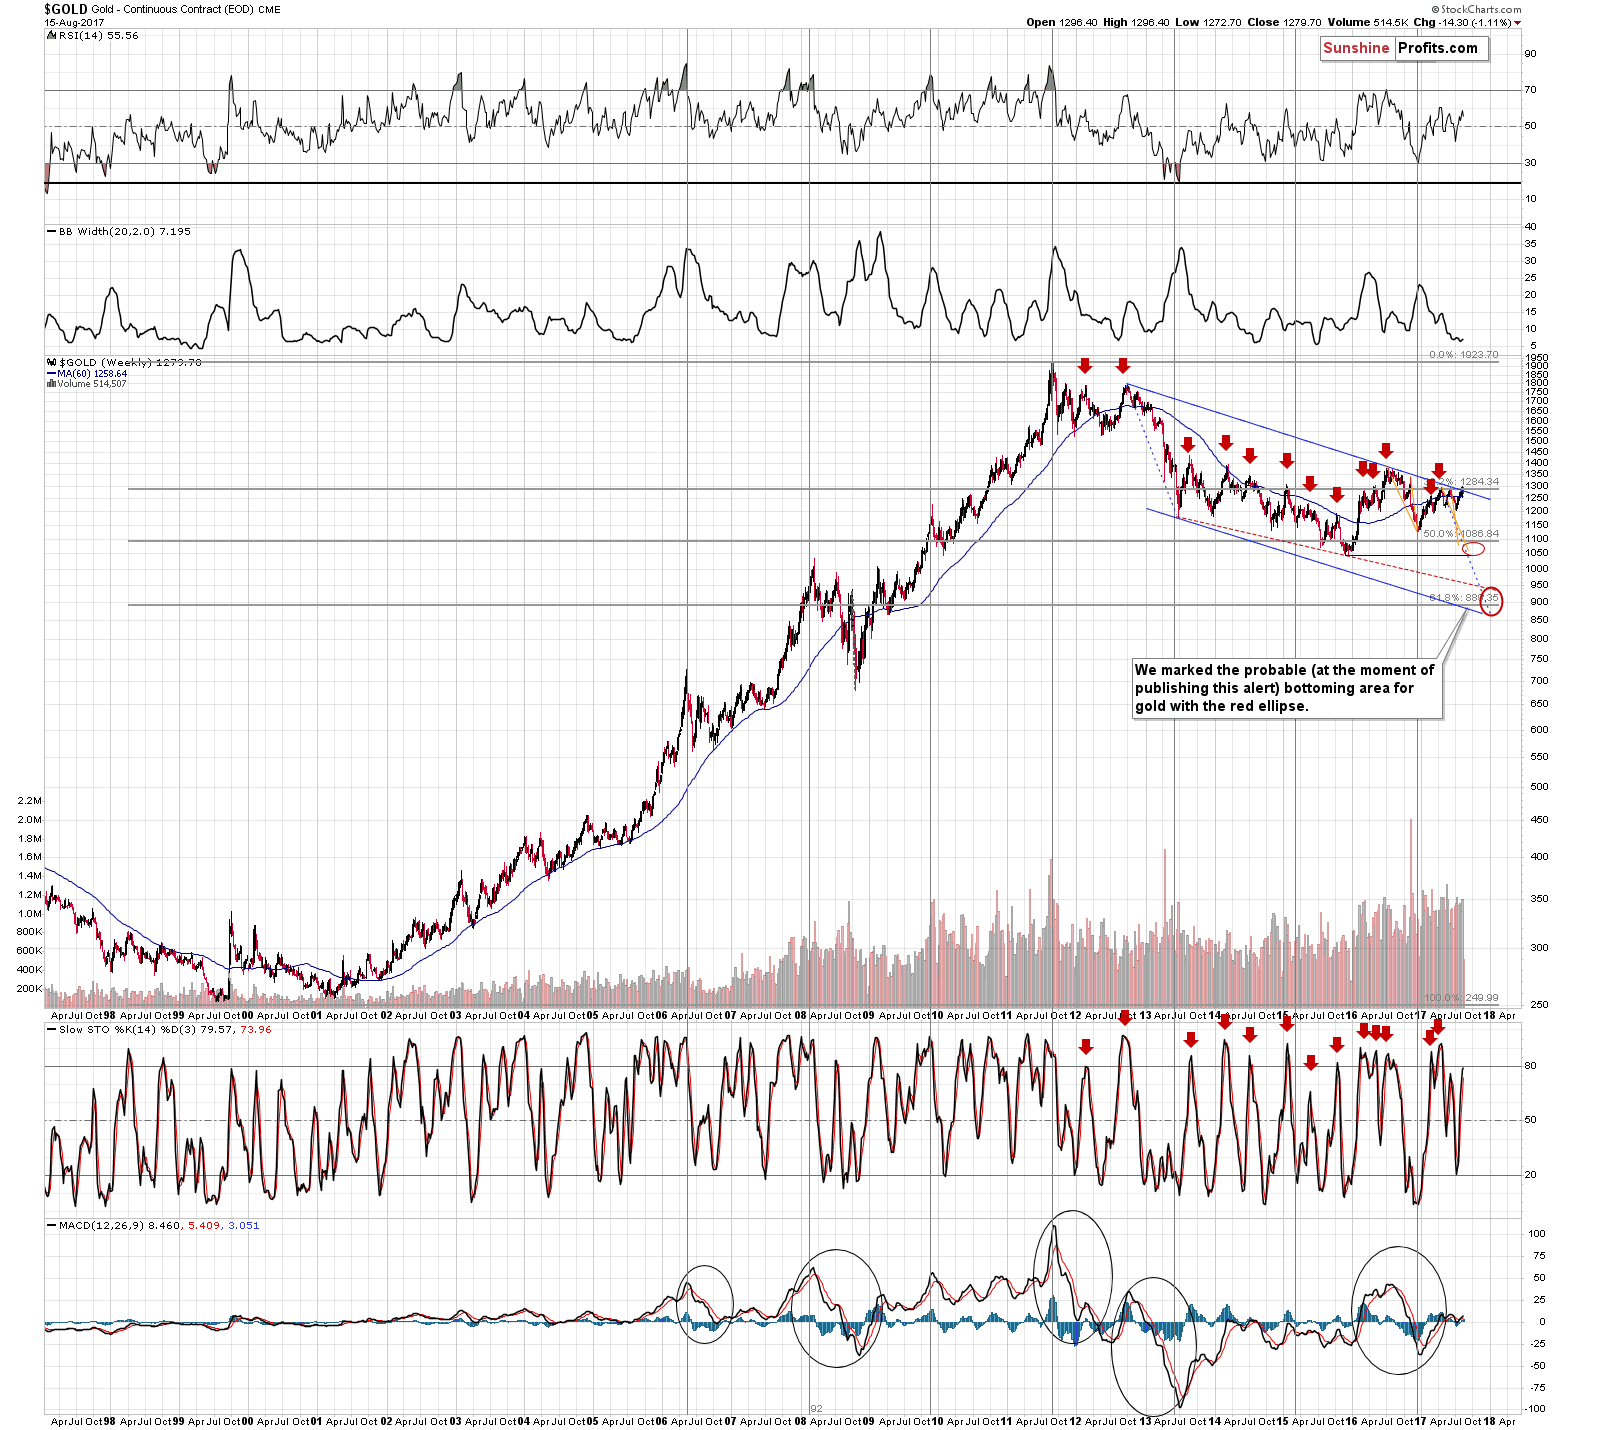
Right above the price chart, we added the Bollinger Band’s Width indicator, which is a proxy for an asset’s (here: gold’s) volatility. As you can see, the major bottoms in the indicator and in the gold volatility index correspond to each other.
What happened after volatility moved to the very low levels and stayed there for a considerable amount of time? A huge move usually followed. The 1999 bottom, the 2002-2003 spike, the 2005-2006 rally, the 2007-2008 rally, the mid-2012 rally, the huge 2013 slide, the mid-2014 slide, the mid-2015 slide were all preceded by extremely low volatility, similar to the one that we’re experiencing right now.
To be clear, the above – by itself – is not enough to say that gold will move below its previous lows this time, but it very strongly suggests that such a move is likely to happen sooner rather than later and that this is not the time to stop paying attention to what’s going on in gold.
The thing that makes a huge difference this time is the situation in the USD Index.
(Click on image to enlarge)
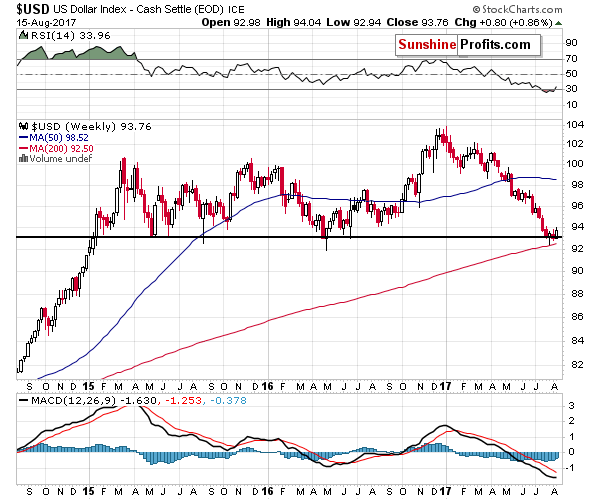
In the July 31 Gold & Silver Trading Alert, we wrote the following on the above chart:
The USD Index closed the week in tune with the 2015 and 2016 bottoms. Both previous bottoms took place close to the middle of the year, so the timing for the current move lower also supports that reversal theory.
The USD Index reached the previous weekly bottoms and it suggests that the bottom is in – in weekly terms. In other words, this week’s closing price is very likely to be higher than 93.11. What the above does not say is how the USD Index will perform before the end of the week – even if we saw a temporary downswing to about 92 and then a big comeback (just like the one we saw in 2016 after the weekly bottom), it would still not invalidate the bullish implications or the analogy in general.
The situation developed in tune with our expectations – the USD moved a bit lower, but reversed and ended the week higher. It’s also higher this week, trading at about 94 at the moment of writing these words. The bottom in the USD Index seems to be in. The implications thereof are particularly significant, because gold has generally refused to follow in the USD’s footsteps earlier this year – the latter has declined for the entire 2017, while gold moved higher only in the first quarter – it’s been moving back and forth since that time, ignoring the big moves in the USD.
If gold has been refusing to rally following one of its key drivers, this strongly suggests that the yellow metal “wants to move” in the opposite direction. The USD’s continued and accelerating decline made it impossible for gold to move in tune with its current major trend. However, if the USD Index has bottomed – and it seems to be the case – then gold may be ready for a massive decline in the coming weeks.
Summing up, the extremely low volatility in gold makes it likely that the upcoming move will be huge. The situation in the USD Index also makes it likely that the move in gold will be huge, and that it will be to the downside. The resistance levels on gold’s long-term chart along with confirmations from the short-term signals and the mining stock sector make it likely that the final decline has just started. The times ahead appear to be anything but boring and it seems to be the perfect time to stay updated on the latest developments on the precious metals market
The above estimations are based on the information that we have available today. We will be monitoring the market for opportunities and report to our subscribers accordingly. If you’d like to ...
more

