
Advertisement
Advertisement
USD/CHF Is Now In Uptrend From 0.9420
By:
USDCHF recently broke below the bottom support trend line of the price channel on its 4-hour chart, suggesting that the upside movement from 0.9420 had

USDCHF recently broke below the bottom support trend line of the price channel on its 4-hour chart, suggesting that the upside movement from 0.9420 had completed at 0.9836 already. Near-term support is at 0.9704, a breakdown below this level could trigger another fall towards 0.9564.
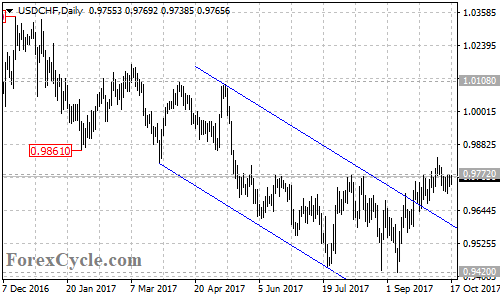
However, the fall from 0.9836 would possibly be a correction of the uptrend from 0.9420. Let’s look into the daily chart, the USDCHF pair broke out of the top trend line of the price channel and it continued to move through an important resistance level at 0.9772, indicating that the downtrend from 1.0343 had completed at 0.9420 already. The pair is now in an uptrend, as long as the price is above 0.9564 support, the uptrend could be expected to resume and further rise towards 1.0108 is still possible after the correction. Near-term resistance is at 0.9836, above this level could signal resumption of the uptrend.
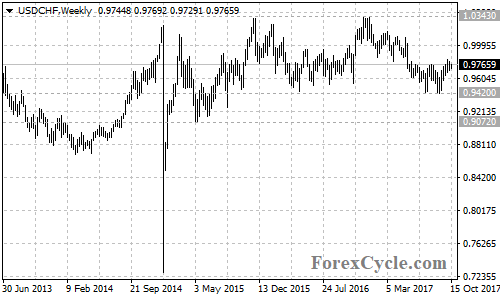
For long term analysis, the USDCHF pair moved sideways in a trading range between 0.9420 and 1.0343 on its weekly chart. Another rise towards the top of the range would likely be seen over the next several weeks. On the other side, the pair might be forming a double top pattern with the neckline at 0.9420 level. A breakthrough the neckline support could trigger 900 pips drops towards 0.8500.
Technical levels
Support levels: 0.9735 (the bottom of the price channel on the 4-hour chart), 0.9704 (the October 13 low), 0.9564 (the September 15 low), 0.9420 (the neckline of the double top pattern on the weekly chart), 0.9072 (the May 2015 low), 0.8500 (the measured move target of the double top pattern).
Resistance levels: 0.9836 (the October 6 high), 0.9861 (the January 31 low), 1.0108 (the April 10 high).
About the Author
Franco Shaocontributor
Did you find this article useful?
Latest news and analysis


Advertisement