
Last test of 100 day MA failed.
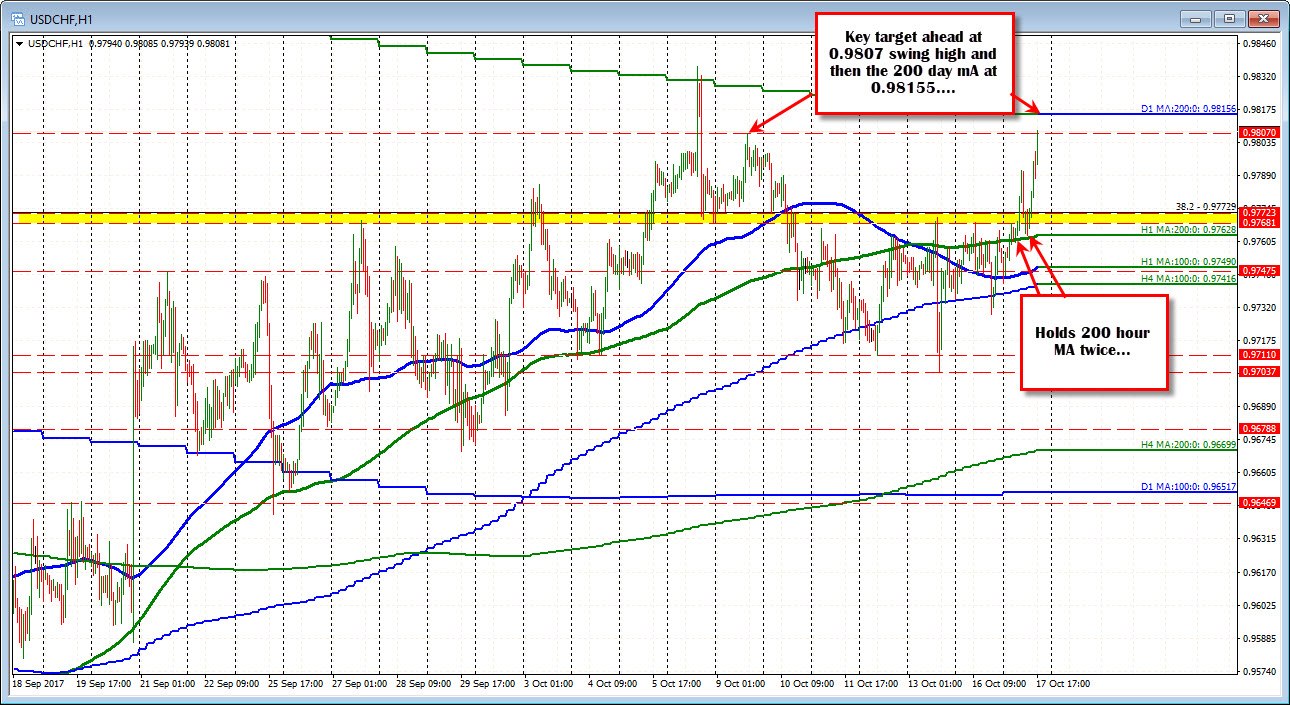
The USDCHF is getting in the USD bullish mode and in the process has pushed to the 0.9800 level (and above now), but the key 100 day MA looms above at the 0.98155 level.
Back on October 6th, the 200 day MA was broken at 0.9830 on its way to a high of 0.9836. That was the highest level since May 17th, and the first peek above the 200 day MA since May 15th.
However, that break stalled and the price rotated back lower (to 0.9704).
The move higher today is making the 2nd play toward that key level.
Looking at the daily chart below the move higher today extended above the 0.9768-0.9772 area. That area is home to a number of swing highs from June, August and September. The high on Friday stalled at 0.9771. That level is a risk level for longs now.
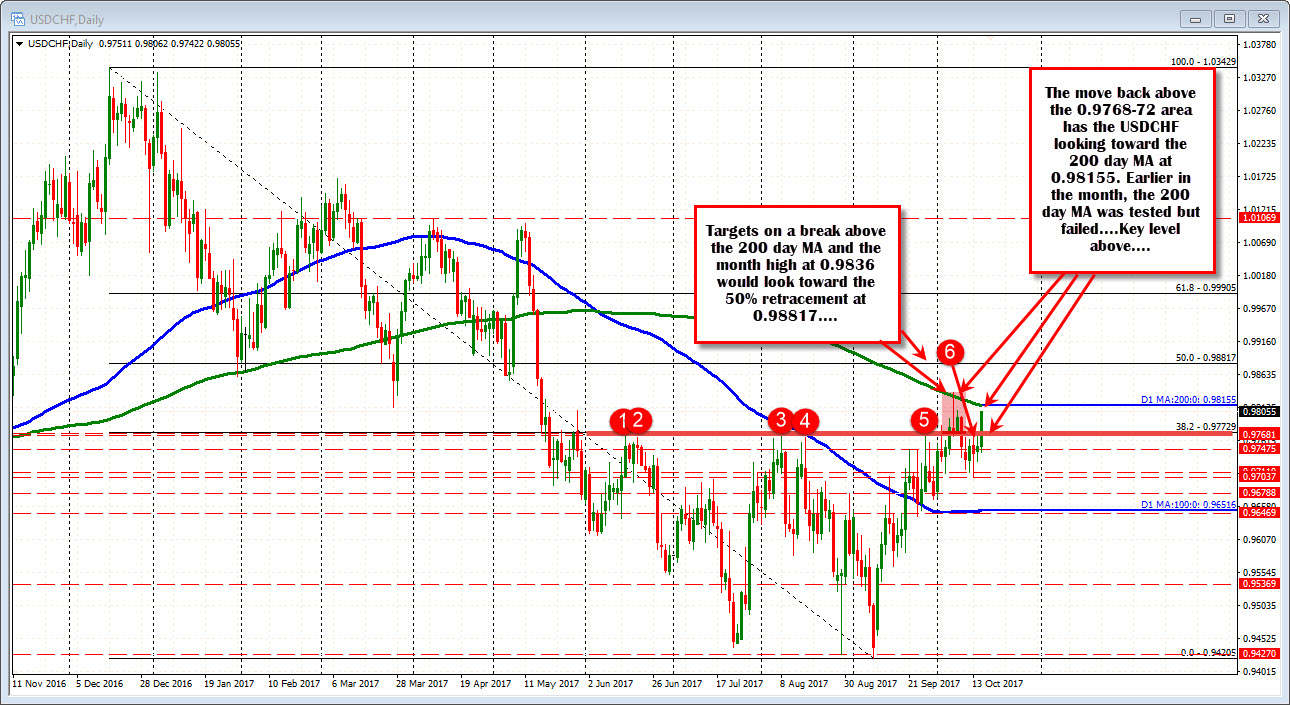
A break above the 200 day MA and the October high at 0.9836 would look toward the 50% retracement of the move down from the December high at 0.98817 (see daily chart).

