
Advertisement
Advertisement
EUR/USD Mid-Session Technical Analysis for October 19, 2017
By:
The EUR/USD is trading higher shortly before the U.S. opening. The Forex pair is following through to the upside following yesterday’s closing price
The EUR/USD is trading higher shortly before the U.S. opening. The Forex pair is following through to the upside following yesterday’s closing price reversal bottom. Today’s price action has also formed a new main and secondary higher bottom.
Short-covering ahead of next week’s European Central Bank meeting may be driving the rally while concerns over the political turmoil in Spain may be limiting gains. The price action even suggests that Spain’s decision to suspend Catalonia’s autonomy after regional leaders failed to drop independence bid may actually be seen as a positive development.
Daily Technical Analysis
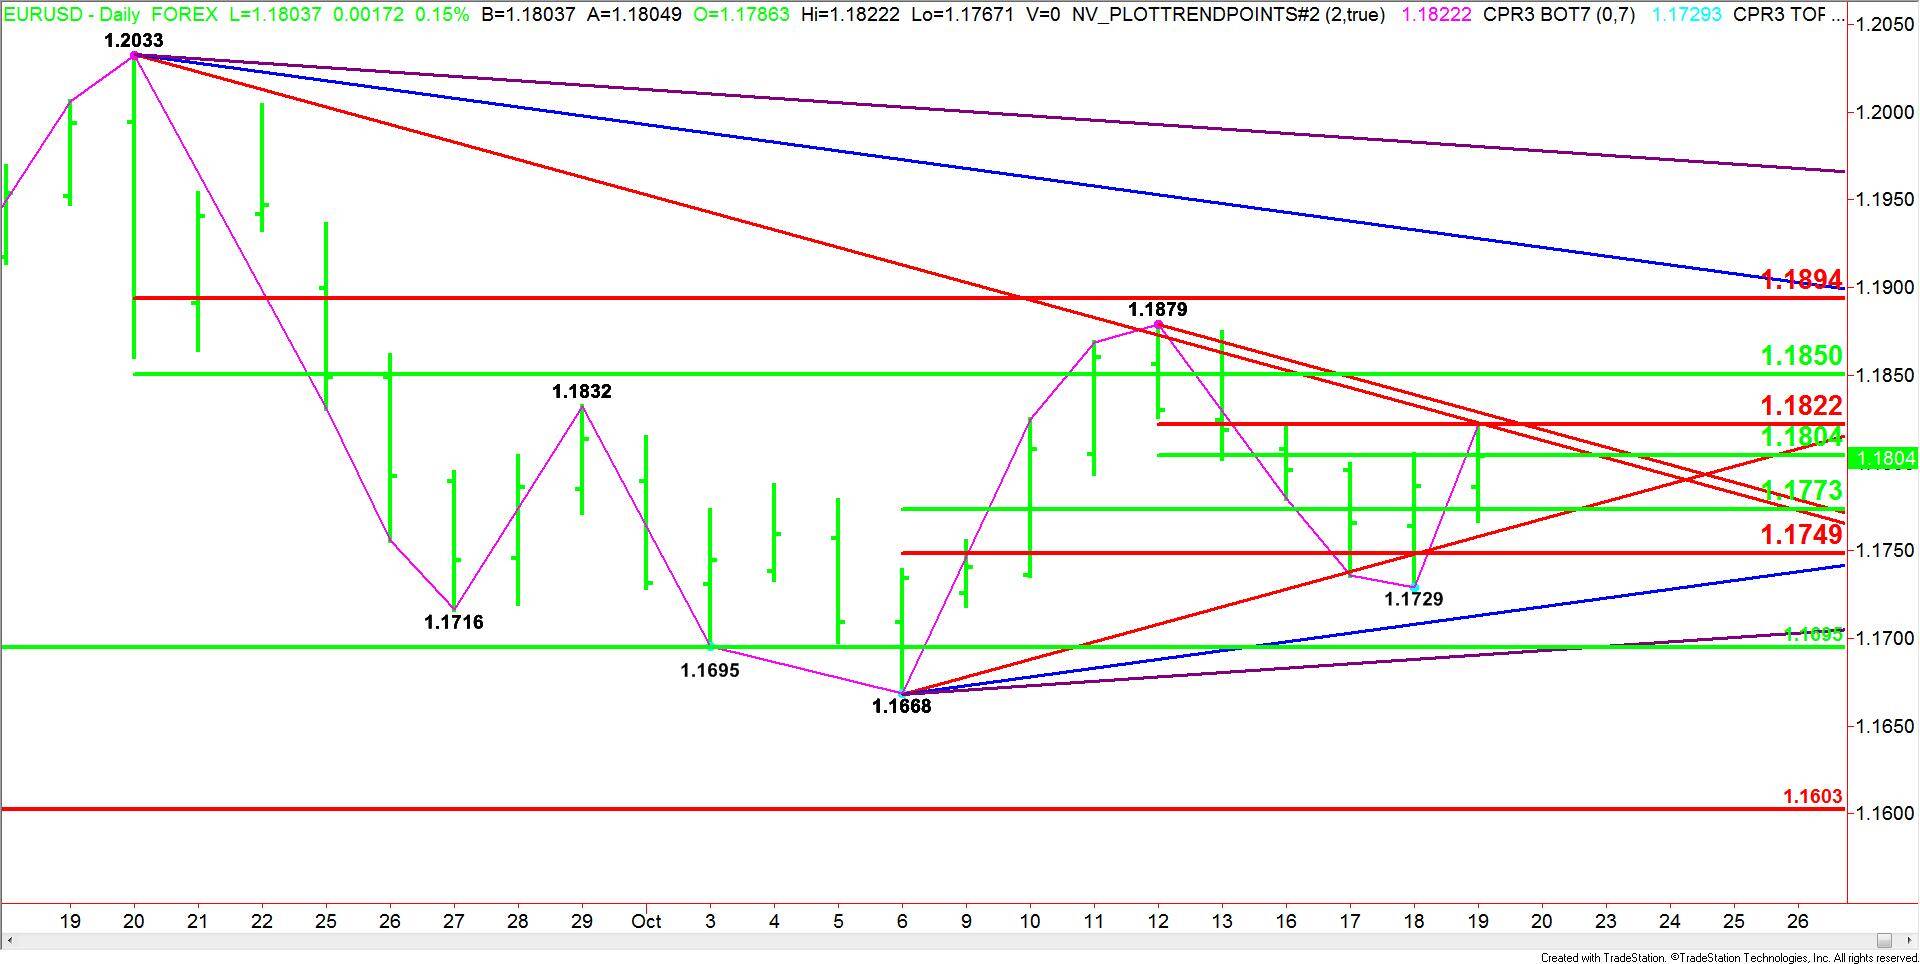
The main trend is up according to the daily swing chart. The follow-through to the upside following yesterday’s closing price reversal has shifted momentum back up after a four-day setback.
A trade through 1.1879 will signal a resumption of the uptrend. This may generate the upside momentum needed to eventually challenge the main top at 1.2033.
Taking out 1.1729 will change the main trend to down. This could trigger a further break into the main bottom at 1.1668.
The EUR/USD is also surrounded by retracement zones that are providing both support and resistance.
On the downside, the support zone is 1.1773 to 1.1749. This is followed by a major retracement zone at 1.1695 to 1.1603.
On the upside, the resistance zone at 1.1804 to 1.1822 is currently being tested. This is followed by another retracement zone at 1.1850 to 1.1894. Overtaking this zone could launch a strong rally.
Daily Forecast
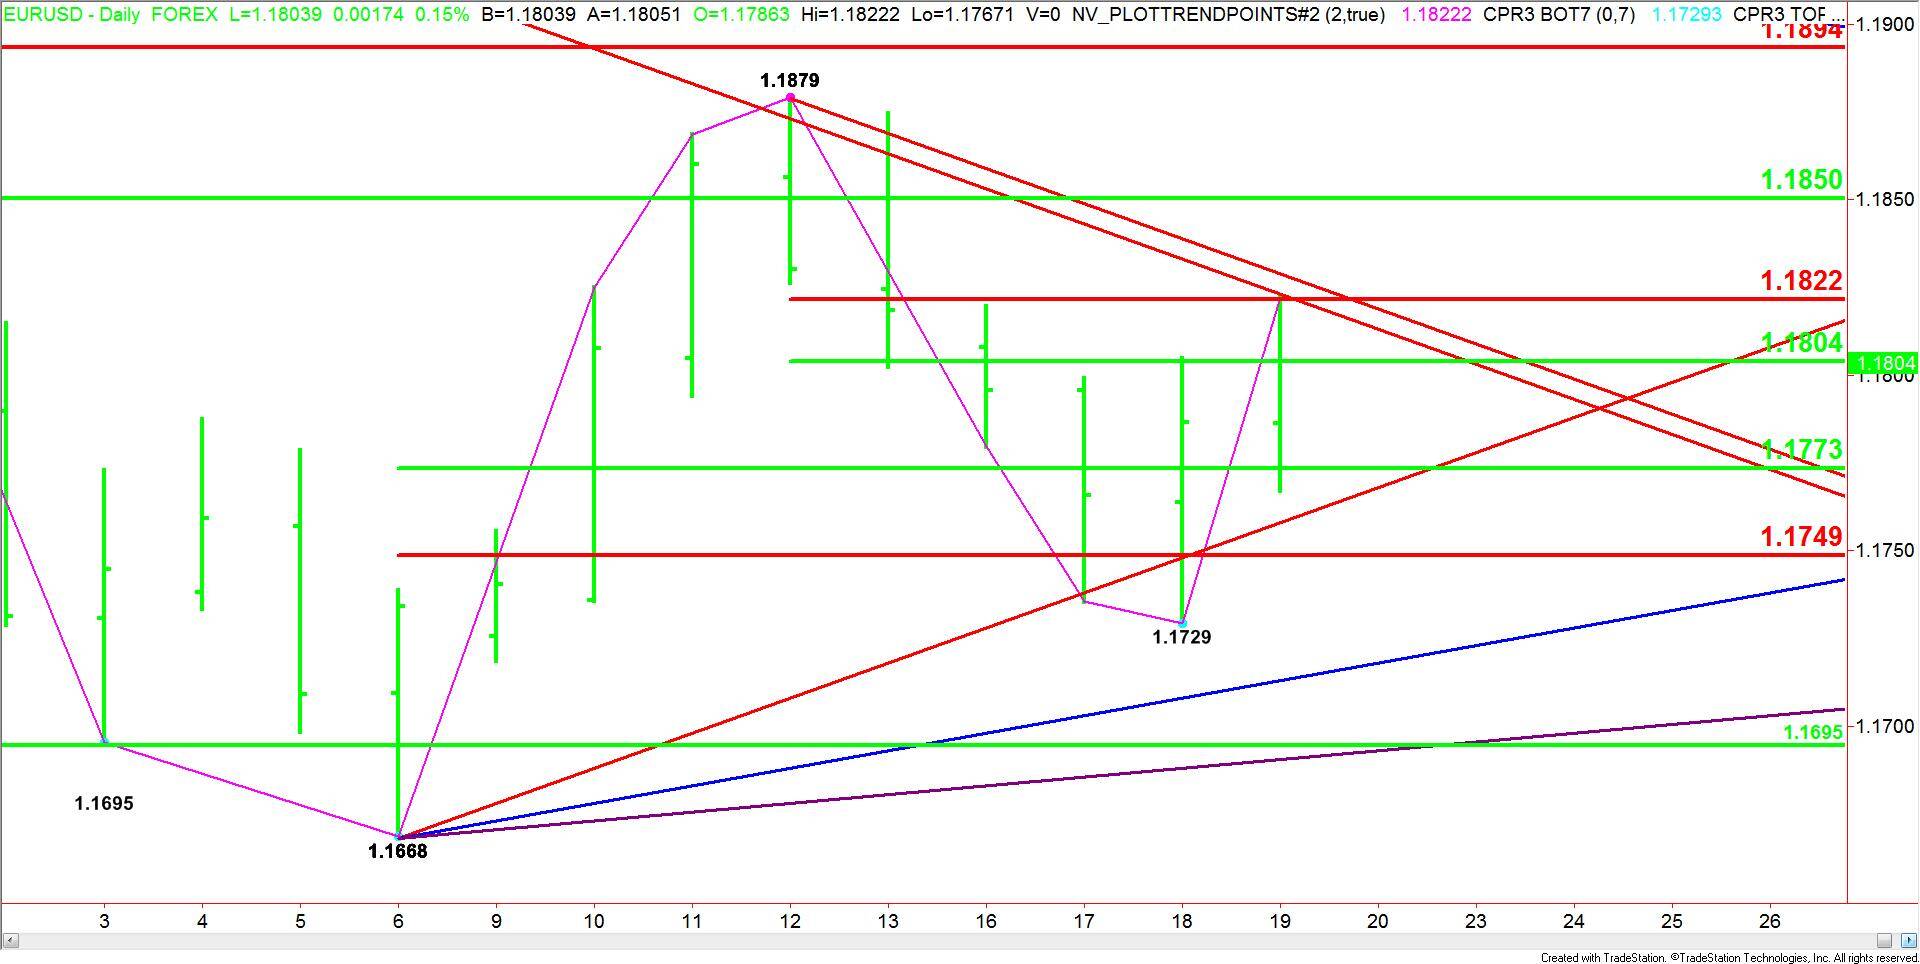
Based on the current price at 1.1802 (0929 GMT) and the earlier price action, the direction of the EUR/USD the rest of the session is likely to be determined by trader reaction to the short-term 50% level at 1.1804.
A sustained move over 1.1804 will indicate the presence of buyers. This could trigger a quick rally into a resistance cluster at 1.1822, 1.1823 and 1.1829. This area stopped a rally earlier in the session.
The daily chart starts to open up to the upside over 1.1829. Taking out this Gann angle could drive the EUR/USD into 1.1850. This is another trigger point for an acceleration into the last main top at 1.1879 and the Fibonacci level at 1.1894.
The inability to overcome 1.1804 will signal the presence of sellers. The next support levels are 1.1773, 1.1758 and 1.1749.
Watch the price action and read the order flow at 1.1804 all session. Be prepared for a strong breakout over 1.1829.
About the Author
James Hyerczykauthor
James is a Florida-based technical analyst, market researcher, educator and trader with 35+ years of experience. He is an expert in the area of patterns, price and time analysis as it applies to futures, Forex, and stocks.
Did you find this article useful?
Latest news and analysis


Advertisement