
Advertisement
Advertisement
Important JPY Pairs’ Technical Overview: 16.11.2017
By:
USD/JPY Although two-month-old upward slanting trend-line triggered the USDJPY’s pullback, a short-term descending trend-channel resistance, at 113.70

USD/JPY
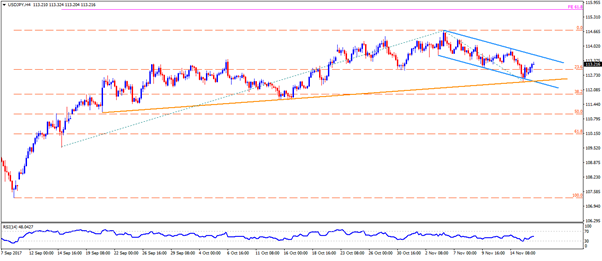
Although two-month-old upward slanting trend-line triggered the USDJPY’s pullback, a short-term descending trend-channel resistance, at 113.70 now, is likely to confine the pair’s immediate advances. Should the pair refrain to respect the channel formation, it can quickly rise to 114.00 and then to the 114.30 levels ahead of aiming to confront the early-month high around 114.75. Moreover, pair’s successful trading beyond 114.75 enables it to extend the northward trajectory in the direction to the 61.8% FE level of 115.65 with 115.00 likely acting as an intermediate halt. On the downside, the 112.70 may offer adjacent rest to the prices in case of a U-turn while the 112.45 support-confluence, comprising channel’s lower-line and aforementioned TL, becomes a strong barrier for the sellers to conquer in order to meet the 112.00 round-figure. During the pair’s additional declines beneath 112.00, the 111.60, the 111.00 and the 110.70 could entertain the Bears.
GBP/JPY
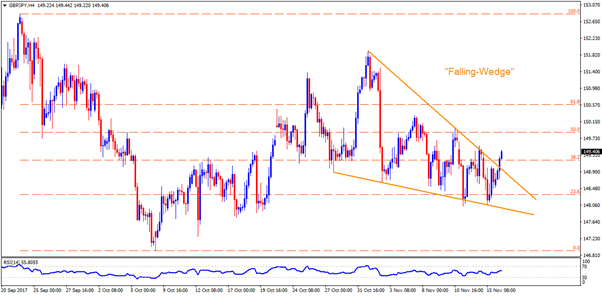
With a clear break of fortnight-long descending trend-line, GBPJPY just confirmed a short-term “Falling-Wedge” Bullish pattern, which in-turn indicates brighter chances of its advances to 149.65 and then to the 150.00 psychological magnets. Given the pair’s ability to break 150.00, the 150.30, the 150.90 and the 151.40 may please the Buyers. In case if the pair fails to justify the bullish formation, the 149.00, the 148.50 and the 148.00 could reappear on the chart. However, while going further down below 148.00, the pair becomes vulnerable to visit the 147.70, the 147.30 and the 146.90 support-levels.
NZD/JPY
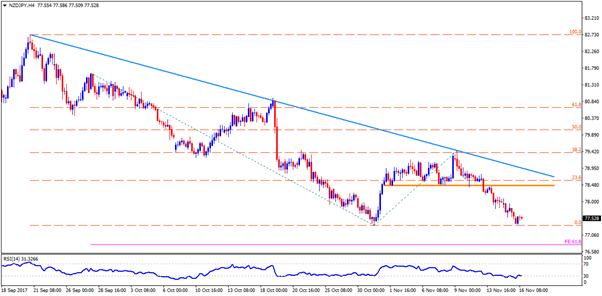
Even if the 77.35-30 region, encompassing October low, triggered the NZDJPY’s pullback, the pair can’t be termed strong even for short-term unless breaking the two-month-old descending trend-line number of 79.00. In the process of doing so, the pair may pass through various intermediate halts like 77.85, the 78.20 and the 78.45-50 horizontal-line. Though, a clear break of 79.00 could open the door for the pair’s northward trajectory towards 79.50, the 79.80 and then the 80.00. Meanwhile, a downside break of 77.30 could further people the Bear-power and drag the pair to 77.00 and to the 61.8% FE level of 76.75. If at all sellers refrain lose their control after 76.75, the 76.30, the 76.00 and the April month low near 75.60 may please them.
CAD/JPY
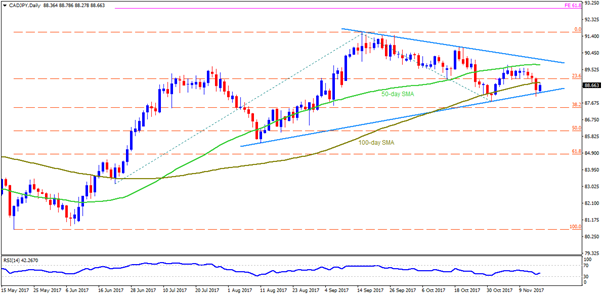
CADJPY’s dip below 100-day SMA couldn’t clear three-month-old ascending trend-line support on a daily closing basis that presently helps the pair to challenge the 88.85 SMA mark. If the pair surpasses the 88.85 at D1 close, the 89.00, the 89.60 and the 50-day SMA level of 89.80 is expected consecutive resistances to threaten its further upside prior to reigniting the importance of two-month-old downward slanting trend-line figure of 90.10. Should the Bulls dominate over the quote after 90.10, the 90.80, the 91.65 and the 61.8% FE level of 93.00 may flash on their radar. Alternatively, a daily closing below 88.20 TL support can fetch the pair to the 87.70, the 87.20 and then to the 86.70 supports. Additionally, the 86.30, the 86.00 and the 85.60 might try limiting the pair’s following downturn below the 86.70.
Cheers and Safe Trading,
Anil Panchal
About the Author
Anil Panchalauthor
An MBA (Finance) degree holder with more than five years of experience in tracking the global Forex market. His expertise lies in fundamental analysis but he does not give up on technical aspects in order to identify profitable trade opportunities.
Did you find this article useful?
Latest news and analysis


Advertisement