With -22.3% EPS Drop, Should Cincinnati Financial Corporation’s (CINF) Recent Track Record Be A Cause Of Concern?

Understanding how Cincinnati Financial Corporation (NASDAQ:CINF) is performing as a company requires looking at more than just a years’ earnings. Today I will run you through a basic sense check to gain perspective on how Cincinnati Financial is doing by comparing its latest earnings with its long-term trend as well as the performance of its insurance industry peers. See our latest analysis for CINF
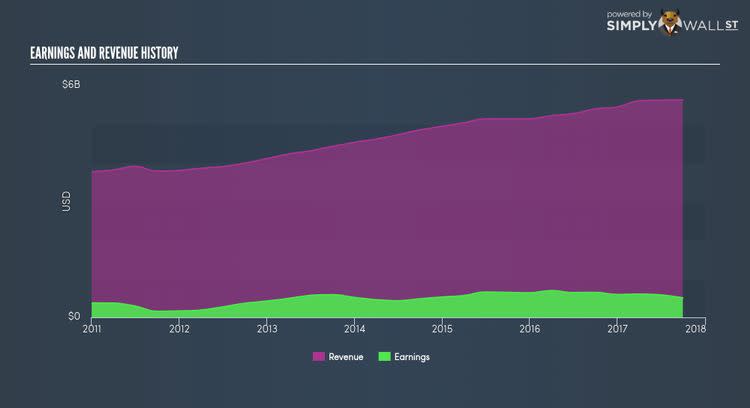
How Did CINF’s Recent Performance Stack Up Against Its Past?
To account for any quarterly or half-yearly updates, I use data from the most recent 12 months, which either annualizes the most recent 6-month earnings update, or in some cases, the most recent annual report is already the latest available financial data. This method allows me to examine different stocks on a similar basis, using new information. For Cincinnati Financial, the latest twelve-month earnings is $503M, which, relative to last year’s figure, has dropped by -22.26%. Since these values are relatively nearsighted, I have computed an annualized five-year value for Cincinnati Financial’s net income, which stands at $479M. This suggests that even though earnings declined against the prior year, in the long run, Cincinnati Financial’s profits have been growing on average.
How has it been able to do this? Well, let’s take a look at whether it is solely because of an industry uplift, or if Cincinnati Financial has seen some company-specific growth. Over the last few years, Cincinnati Financial grew its bottom line faster than revenue by efficiently controlling its costs. This resulted in a margin expansion and profitability over time. Inspecting growth from a sector-level, the US insurance industry has been enduring some headwinds in the previous year, leading to an average earnings drop of -2.66%. This is a significant change, given that the industry has been delivering a positive rate of 9.10%, on average, over the past couple of years. This means any recent headwind the industry is enduring, it’s hitting Cincinnati Financial harder than its peers.
What does this mean?
While past data is useful, it doesn’t tell the whole story. Companies are profitable, but have unpredictable earnings, can have many factors influencing its business. You should continue to research Cincinnati Financial to get a better picture of the stock by looking at:
1. Future Outlook: What are well-informed industry analysts predicting for CINF’s future growth? Take a look at our free research report of analyst consensus for CINF’s outlook.
2. Financial Health: Is CINF’s operations financially sustainable? Balance sheets can be hard to analyze, which is why we’ve done it for you. Check out our financial health checks here.
3. Other High-Performing Stocks: Are there other stocks that provide better prospects with proven track records? Explore our free list of these great stocks here.
NB: Figures in this article are calculated using data from the last twelve months, which refer to the 12-month period ending on the last date of the month the financial statement is dated. This may not be consistent with full year annual report figures.
To help readers see pass the short term volatility of the financial market, we aim to bring you a long-term focused research analysis purely driven by fundamental data. Note that our analysis does not factor in the latest price sensitive company announcements.
The author is an independent contributor and at the time of publication had no position in the stocks mentioned.
