The first of a series of MA being tested as the pair rotates back lower
The GBPUSD is now trading lower on the day, after a run higher (and a break to a new 11 day highs failed. The pair completed its up and down lap. Concerns about Brexit seem to be the catalyst (the stock excuse for a sell off but with truth to it).
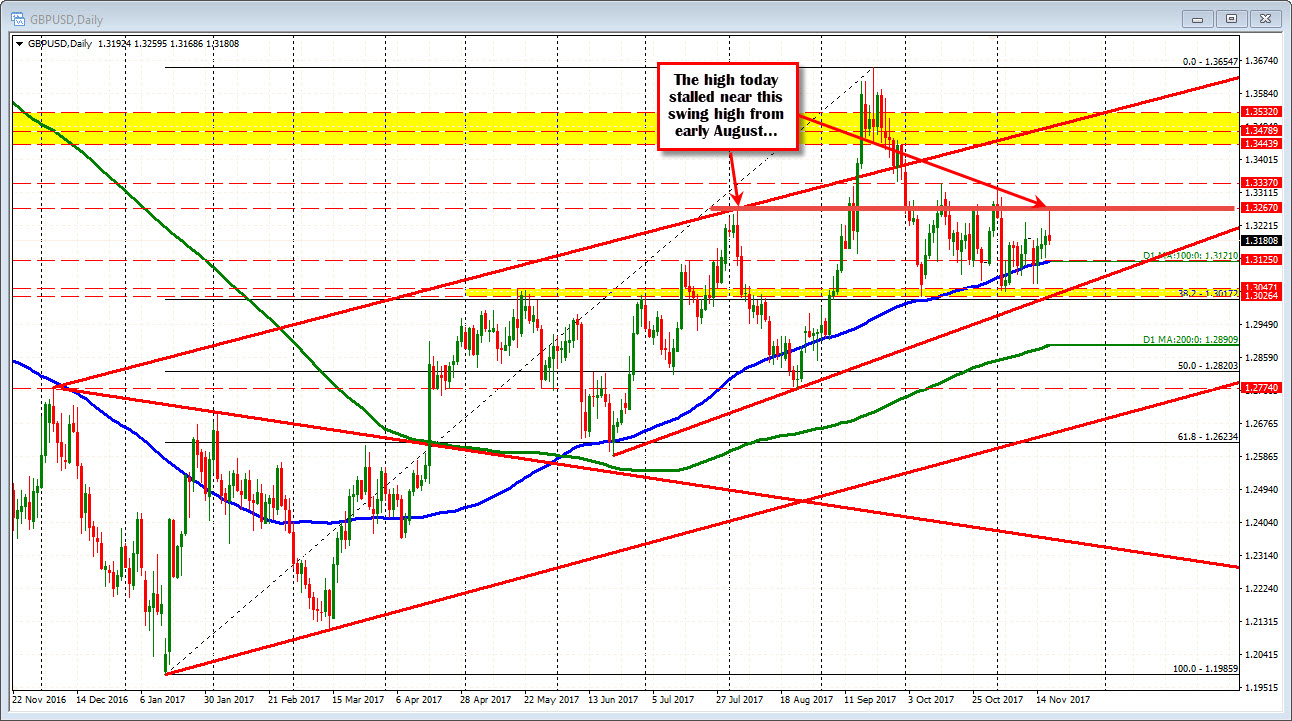
Technically, the rise today, stalled just shy of the swing high from back in early AUgust (see chart above).
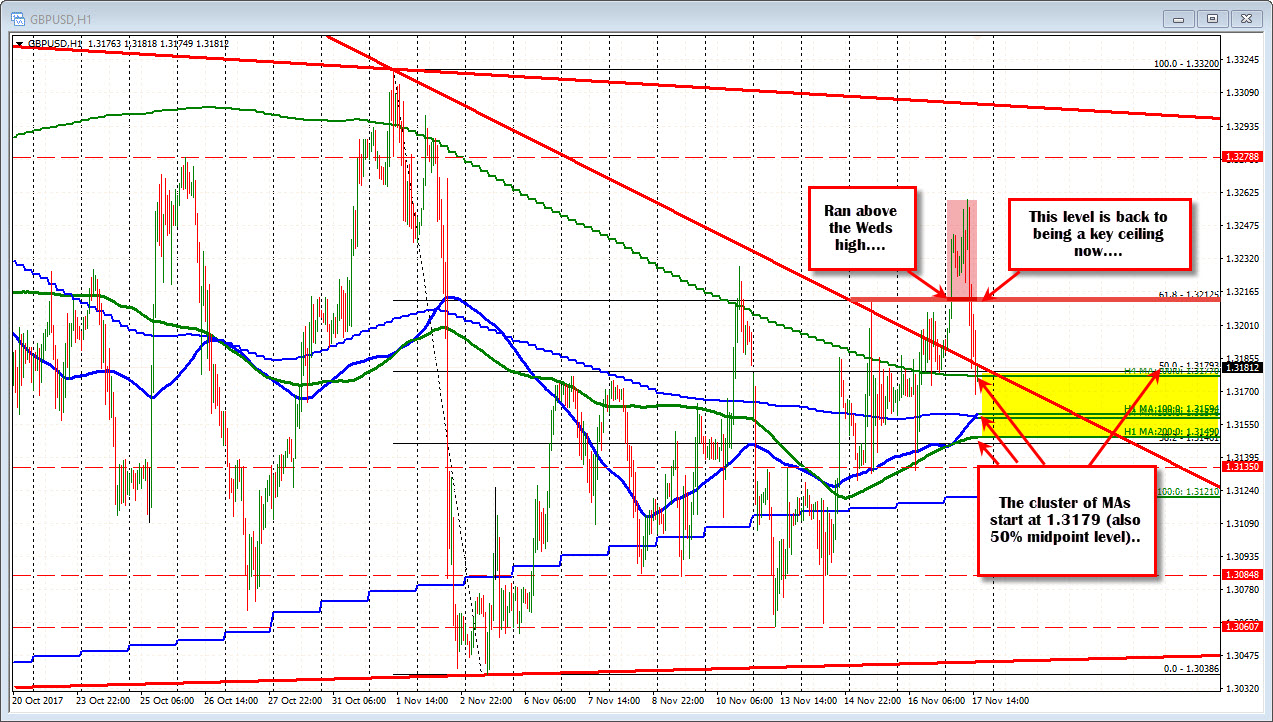
The fall has taken the pair back to the first of a cluster of MA (and back near the 50% of the 13 day high to low trading range at 1.31793 - see hourly chart below).
The first MA being tested is the 200 bar MA on the 4-hour chart at 1.31778. Below that MA is the 100 hour MA at 1.31594, the 100 bar MA on the 4-hour chart at 1.3158. The 200 hour MA comes in at 1.3149.
Those MAs are now the steps/targets/technical levels in the way that the sellers have to contend with on a further fall. When the price tumbles lower without much of a breathe, those levels can have a way to stall a fall. We are sort of seeing that now, despite the crack below the 200 bar MA on the 4-hour and 50%. There is a breathe being taken.
Do we get the bounce? This is a level where some traders will take profit/may be stick a toe in the water, but the buyers have to prove they can take the price higher. So will be watching if the price can get above 1.3200 too and then the 1.3125 level (61.8% and swing high from Wednesday's trading).