Tuesday, November 21, 2017 12:36 PM EDT
ETH/USD Daily Chart
(Click on image to enlarge)
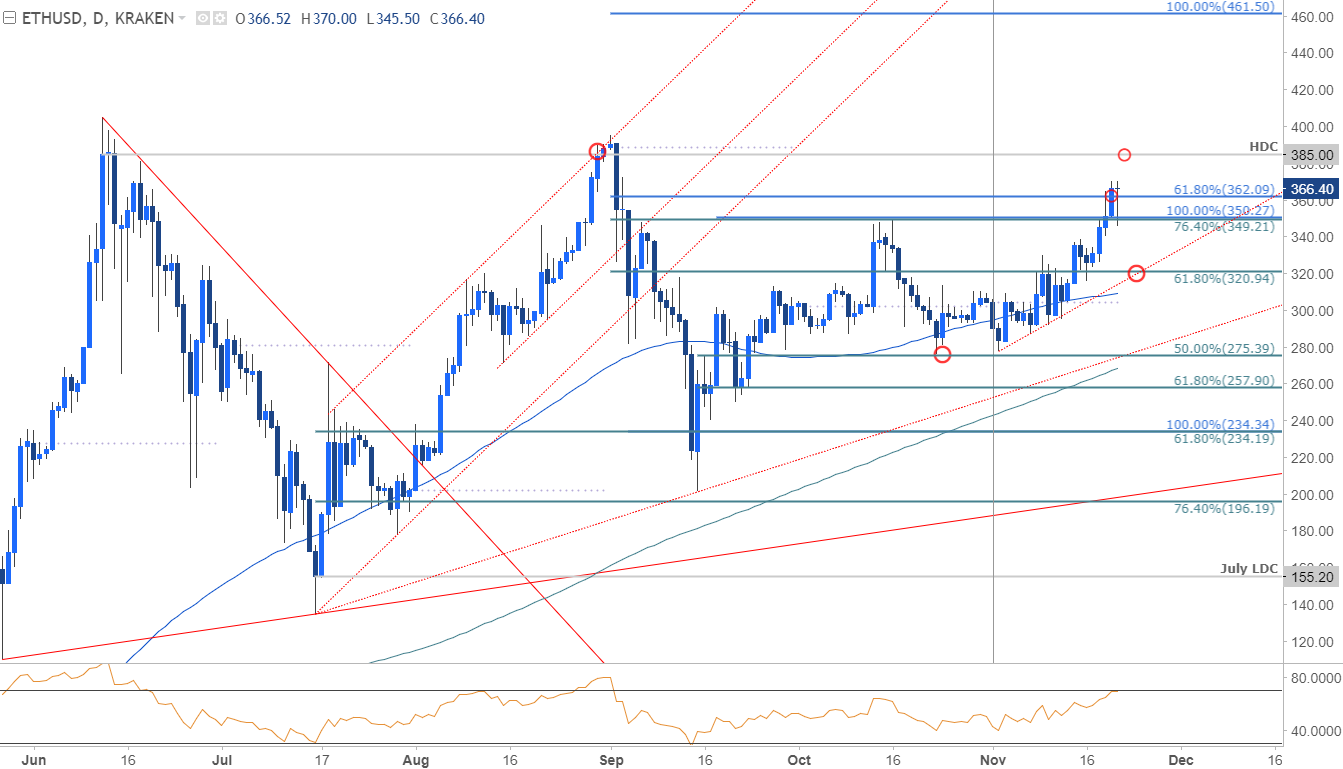
Technical Outlook: We’ve been tracking this rally in Ethereum prices since the breach above the November opening range earlier in the month with the advance already taking out initial targets at 350 & 362. Critical topside resistance objectives are eyed at the high-day close at 385 backed by the record high at 405. Interim support now rests back at 349 with bullish invalidation now raised to 315/20. A break below the monthly open at 304 would be needed to put the bears in control.
ETH/USD 240min Chart
(Click on image to enlarge)
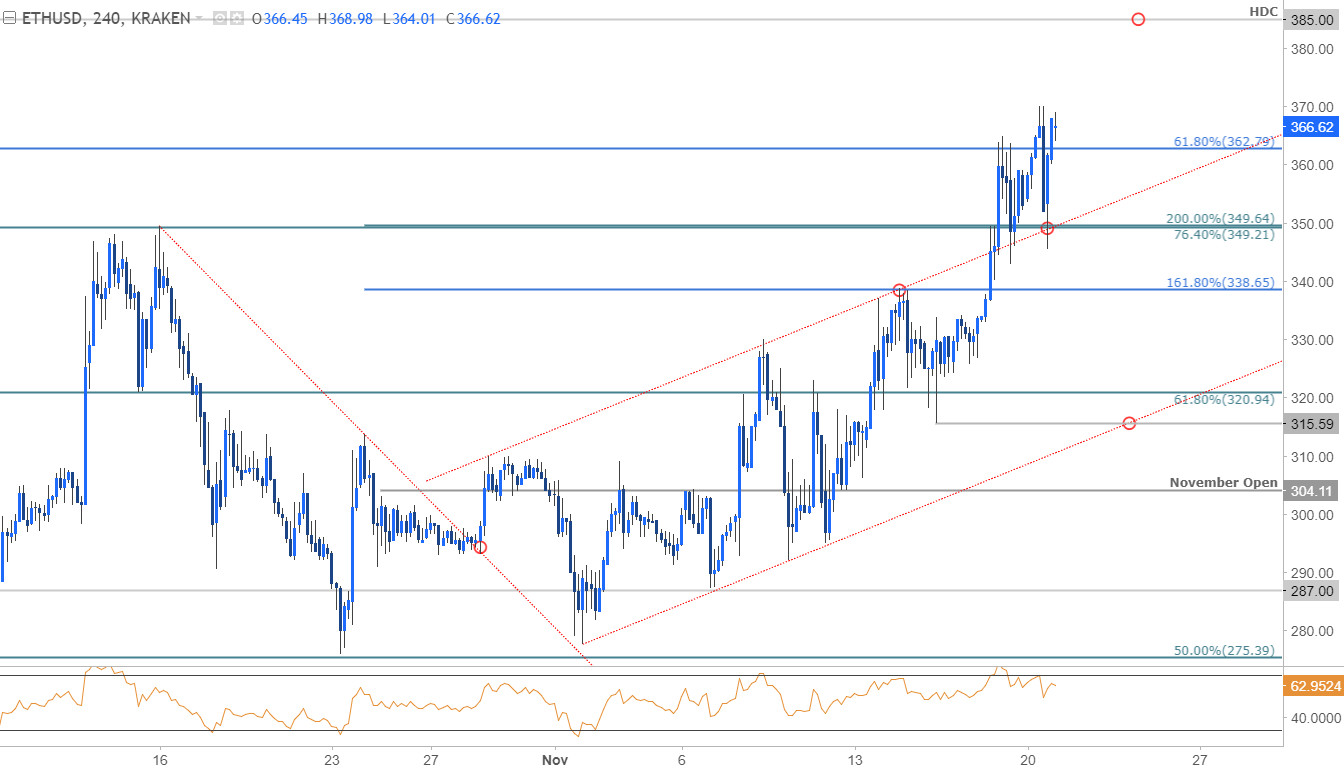
Notes: A closer look at price action shows Ethereum breaking above channel resistance before checking this slope as support last night. Note that the near-term momentum profile looks a bit tired here and leaves the immediate advance vulnerable. Bottom line: while we could see some pullback from here, the outlook remains weighted to the topside and we’ll favor fading weakness while above 315.
Disclosure: DailyFX, the free news and research website of leading forex and CFD broker FXCM, delivers up-to-date analysis of the ...
more
Disclosure: DailyFX, the free news and research website of leading forex and CFD broker FXCM, delivers up-to-date analysis of the fundamental and technical influences driving the currency and commodity markets. With nine internationally-based analysts publishing over 30 articles and producing 5 video news updates daily, DailyFX offers in-depth coverage of price action, predictions of likely market moves, and exhaustive interpretations of salient economic and political developments. DailyFX is also home to one of the most powerful economic calendars available on the web, complete with advanced sorting capabilities, detailed descriptions of upcoming events on the economic docket, and projections of how economic report data will impact the markets. Combined with the free charts and live rate updates featured on DailyFX, the DailyFX economic calendar is an invaluable resource for traders who heavily rely on the news for their trading strategies. Additionally, DailyFX serves as a portal to one the most vibrant online discussion forums in the forex trading community. Avoiding market noise and the irrelevant personal commentary that plague many forex blogs and forums, the DailyFX Forum has established a reputation as being a place where real traders go to talk about serious trading.
Any opinions, news, research, analyses, prices, or other information contained on dailyfx.com are provided as general market commentary, and does not constitute investment advice. Dailyfx will not accept liability for any loss or damage, including without limitation to, any loss of profit, which may arise directly or indirectly from use of or reliance on such information.
** All times listed in GMT. See the full DailyFX economic calendar here.
less
How did you like this article? Let us know so we can better customize your reading experience.


