Why Exxon Mobil Corporation’s (XOM) ROE Of 7.35% Does Not Tell The Whole Story

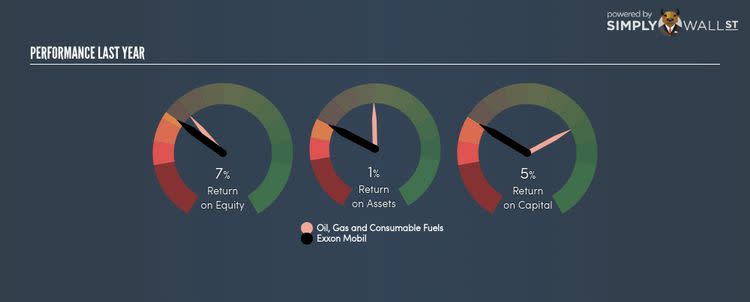
Exxon Mobil Corporation (NYSE:XOM) generated a below-average return on equity of 7.35% in the past 12 months, while its industry returned 9.36%. XOM’s results could indicate a relatively inefficient operation to its peers, and while this may be the case, it is important to understand what ROE is made up of and how it should be interpreted. Knowing these components could change your view on XOM’s performance. Metrics such as financial leverage can impact the level of ROE which in turn can affect the sustainability of XOM’s returns. Let me show you what I mean by this. View our latest analysis for Exxon Mobil
What you must know about ROE
Firstly, Return on Equity, or ROE, is simply the percentage of last years’ earning against the book value of shareholders’ equity. An ROE of 7.35% implies $0.07 returned on every $1 invested. While a higher ROE is preferred in most cases, there are several other factors we should consider before drawing any conclusions.
Return on Equity = Net Profit ÷ Shareholders Equity
Returns are usually compared to costs to measure the efficiency of capital. XOM’s cost of equity is 9.38%. Given a discrepancy of -2.03% between return and cost, this indicated that XOM may be paying more for its capital than what it’s generating in return. ROE can be split up into three useful ratios: net profit margin, asset turnover, and financial leverage. This is called the Dupont Formula:
Dupont Formula
ROE = profit margin × asset turnover × financial leverage
ROE = (annual net profit ÷ sales) × (sales ÷ assets) × (assets ÷ shareholders’ equity)
ROE = annual net profit ÷ shareholders’ equity
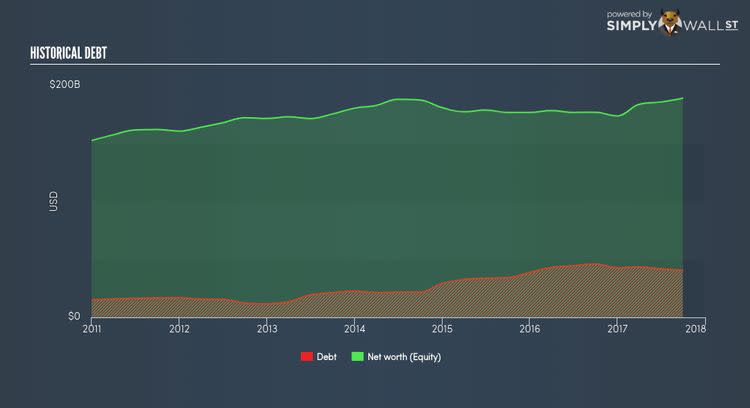
Basically, profit margin measures how much of revenue trickles down into earnings which illustrates how efficient XOM is with its cost management. The other component, asset turnover, illustrates how much revenue XOM can make from its asset base. Finally, financial leverage will be our main focus today. It shows how much of assets are funded by equity and can show how sustainable XOM’s capital structure is. Since financial leverage can artificially inflate ROE, we need to look at how much debt XOM currently has. The debt-to-equity ratio currently stands at a low 21.46%, meaning XOM still has headroom to borrow debt to increase profits.
What this means for you:
Are you a shareholder? XOM’s below-industry ROE is disappointing, furthermore, its returns were not even high enough to cover its own cost of equity. Since its existing ROE is not fuelled by unsustainable debt, investors shouldn’t give up as XOM still has capacity to improve shareholder returns by borrowing to invest in new projects in the future. If you’re looking for new ideas for high-returning stocks, you should take a look at our free platform to see the list of stocks with Return on Equity over 20%.
Are you a potential investor? If you are considering investing in XOM, basing your decision on ROE alone is certainly not sufficient. I recommend you do additional fundamental analysis by looking through our most recent infographic report on Exxon Mobil to help you make a more informed investment decision.
To help readers see pass the short term volatility of the financial market, we aim to bring you a long-term focused research analysis purely driven by fundamental data. Note that our analysis does not factor in the latest price sensitive company announcements.
The author is an independent contributor and at the time of publication had no position in the stocks mentioned.
