


Bitcoin, Ripple, Ether, Litecoin - News and Talking Points
- Bitcoin and Ripple Continue to Struggle.
- Ethereum and Litecoin May be Finding Short-term Support.
Bitcoin Struggles to Move Higher
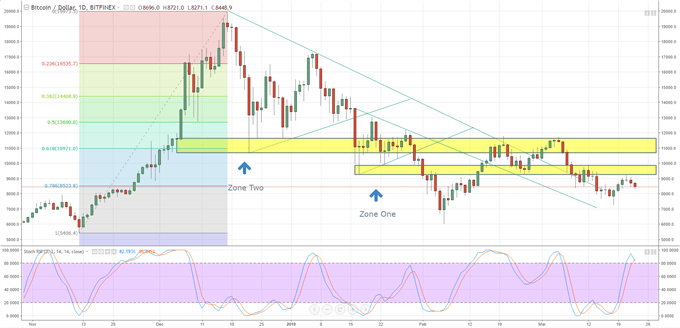
Bitcoin has had another struggle this week with the price falling back to this week’s low ahead of the weekend.Upside remains limited with resistance around $9,260 acting as a strong barrier, while the downside target of $6,000 remain intact after BTC broke the 78.6% retracement level at $8523. The stochastic level has also turned lower from its current extremely overbought level, leaving further downside on the cards. Bitcoin is also in the process of forming a very negative ‘death cross’ formation which would add extra credibility to calls for lower prices.
Bitcoin (BTC) Price Chart in US Dollars(November 1, 2017 – March 23, 2018)
Ripple Remains Weak and May Re-Test Recent Lows
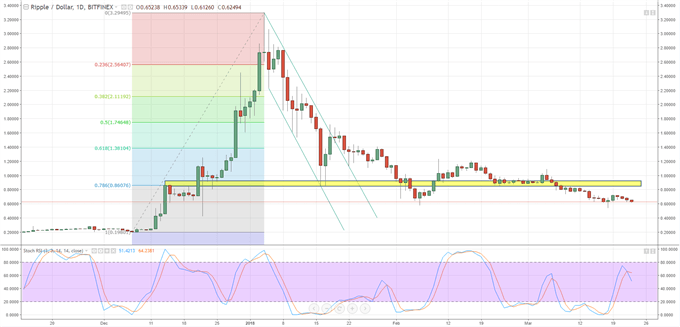
Another token that seems unable to push higher with last low around $0.54 the first target. Below this the December 22 low of $0.42 comes into play before a possible complete re-trace of the December 7 – January 4 rally back to $0.20. Resistance between $0.72 and a cluster around $0.78 should prove difficult to break back above in the current environment.
Ripple (XRP) Price Chart in US Dollars (November 13, 2017 - March 23, 2018)
Ethereum Trades Around Fibonacci Re-Tracement
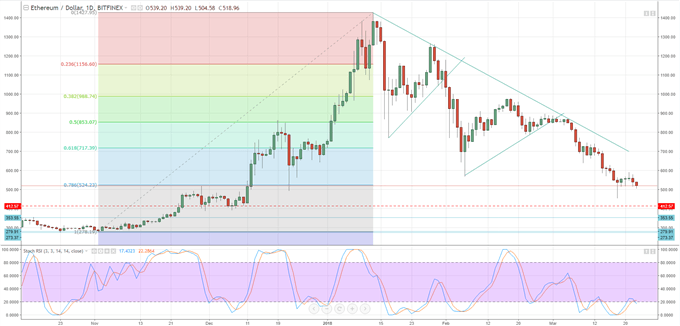
The second-largest digital token is currently battling with 78.6% re-tracement at $524 after its recent heavy drop. While the chart still looks bearish – the down channel from the January 13 all-time high continues to be respected – a move slightly higher cannot be discounted to the $570 level although this may trigger further selling interest. The stochastic indicator also sits in oversold territory, just, and may provide some support in the short-term.
Ethereum (ETH) Price Chart in US Dollars (October 13, 2017 – March 23, 2018)
Litecoin Chart Gives Little Away
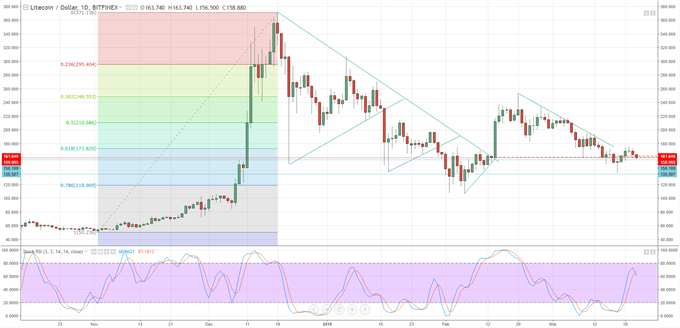
LTC currently sits on the down channel trend line, just below 61.8% retracement at $172 and just above the February 14 low at $159. The stochastic indicator is just above mid-market and nudging lower. With little in the way of strong direction on the chart at the moment we would prefer to watch this from the sidelines until a break one way or another is seen.
Litecoin (LTC) Price Chart in US Dollars (October 13, 2017 – March 23, 2018)
Essential Cryptocurrency Trader Resources
If you are interested in trading Bitcoin, Ripple, Ether or Litecoin check out our Introduction to Bitcoin Trading Guide.
What’s your view of the cryptocurrency market – oversold or overbought? You can leave your comments in the section below or you can contact the author by email at nicholas.cawley@ig.com or via Twitter @nickcawley1.
--- Written by Nick Cawley, Analyst.


