How VOC Energy Trust (NYSE:VOC) Delivered A Better ROE Than Its Industry

VOC Energy Trust (NYSE:VOC) delivered an ROE of 10.16% over the past 12 months, which is an impressive feat relative to its industry average of 9.06% during the same period. While the impressive ratio tells us that VOC has made significant profits from little equity capital, ROE doesn’t tell us if VOC has borrowed debt to make this happen. In this article, we’ll closely examine some factors like financial leverage to evaluate the sustainability of VOC’s ROE. Check out our latest analysis for VOC Energy Trust
Peeling the layers of ROE – trisecting a company’s profitability
Return on Equity (ROE) weighs VOC Energy Trust’s profit against the level of its shareholders’ equity. For example, if the company invests $1 in the form of equity, it will generate $0.1 in earnings from this. While a higher ROE is preferred in most cases, there are several other factors we should consider before drawing any conclusions.
Return on Equity = Net Profit ÷ Shareholders Equity
ROE is assessed against cost of equity, which is measured using the Capital Asset Pricing Model (CAPM) – but let’s not dive into the details of that today. For now, let’s just look at the cost of equity number for VOC Energy Trust, which is 10.05%. This means VOC Energy Trust returns enough to cover its own cost of equity, with a buffer of 0.11%. This sustainable practice implies that the company pays less for its capital than what it generates in return. ROE can be broken down into three different ratios: net profit margin, asset turnover, and financial leverage. This is called the Dupont Formula:
Dupont Formula
ROE = profit margin × asset turnover × financial leverage
ROE = (annual net profit ÷ sales) × (sales ÷ assets) × (assets ÷ shareholders’ equity)
ROE = annual net profit ÷ shareholders’ equity

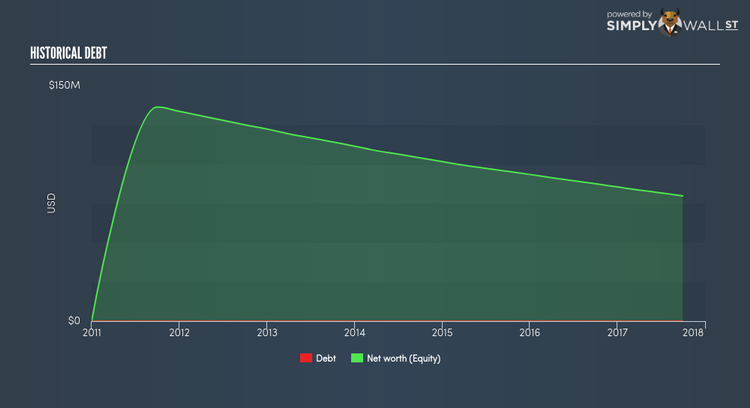
Basically, profit margin measures how much of revenue trickles down into earnings which illustrates how efficient the business is with its cost management. Asset turnover reveals how much revenue can be generated from VOC Energy Trust’s asset base. Finally, financial leverage will be our main focus today. It shows how much of assets are funded by equity and can show how sustainable the company’s capital structure is. Since financial leverage can artificially inflate ROE, we need to look at how much debt VOC Energy Trust currently has. Currently, VOC Energy Trust has no debt which means its returns are driven purely by equity capital. Therefore, the level of financial leverage has no impact on ROE, and the ratio is a representative measure of the efficiency of all its capital employed firm-wide.
What this means for you:
Are you a shareholder? VOC exhibits a strong ROE against its peers, as well as sufficient returns to cover its cost of equity. Since ROE is not inflated by excessive debt, it might be a good time to add more of VOC to your portfolio if your personal research is confirming what the ROE is telling you. If you’re looking for new ideas for high-returning stocks, you should take a look at our free platform to see the list of stocks with Return on Equity over 20%.
Are you a potential investor? If you are considering investing in VOC, looking at ROE on its own is not enough to make a well-informed decision. I recommend you do additional fundamental analysis by looking through our most recent infographic report on VOC Energy Trust to help you make a more informed investment decision.
To help readers see pass the short term volatility of the financial market, we aim to bring you a long-term focused research analysis purely driven by fundamental data. Note that our analysis does not factor in the latest price sensitive company announcements.
The author is an independent contributor and at the time of publication had no position in the stocks mentioned.
