
Advertisement
Advertisement
Technical Update For EUR/USD, USD/JPY, AUD/USD & USD/CAD: 23.01.2018
By:
EUR/USD Notwithstanding the EURUSD’s inability to sustain 1.2300 break, the short-term symmetrical triangle seem restricting the pair’s immediate moves

EUR/USD
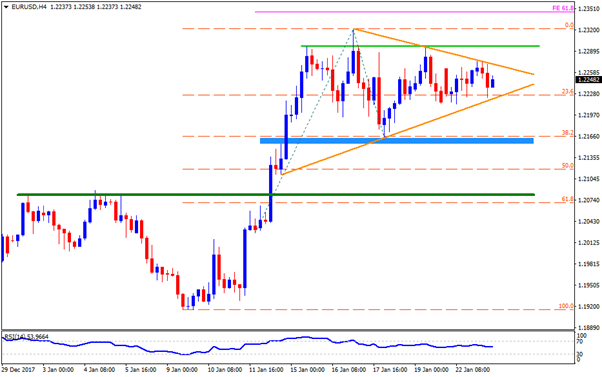
Notwithstanding the EURUSD’s inability to sustain 1.2300 break, the short-term symmetrical triangle seem restricting the pair’s immediate moves between 1.2275 and the 1.2215 levels. Should the pair drops beneath the 1.2215 support, it can quickly test the 1.2165-55 rest-area, which if broken could further drag the quote towards the 1.2110 and then to the 1.2085-80 region. If at all prices continue declining below 1.2080, the 1.2020, the 1.2000 and the 1.1980 can please the sellers. On the upside, a clear break of 1.2275 needs to surpass the 1.2295 – 1.2300 zone in order to aim for recent high around 1.2325. Moreover, pair’s successful trading beyond 1.2325 enables it to challenge the 61.8% FE level of 1.2350, conquering which could propel its northward trajectory to 1.2470-75 and to the 1.2500 mark.
USD/JPY
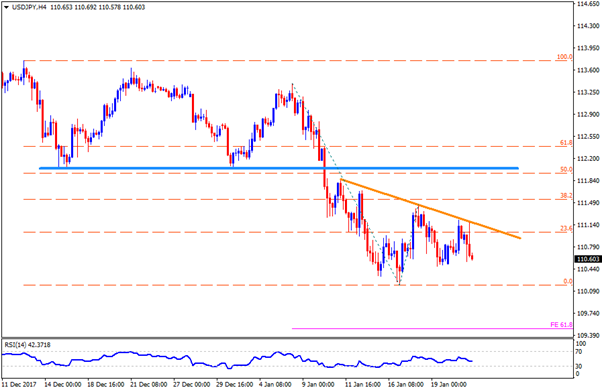
Unlike expected sideways movement of the EURUSD, a fortnight long descending trend-line portrays more downside of the USDJPY. As a result, chances of the pair’s drop to 110.50 and then to the 110.15 are brighter; though, 110.00 round-figure could try limiting its follow-on downturn, failing to which can trigger the pair’s plunge to 61.8% FE level of 109.50. Given the Bears command over momentum after 109.50, it becomes wise to expect 108.60 as a target while being short. Meanwhile, break of 111.20 TL resistance may activate the pair’s recovery to the 111.70 and the 111.90 but 112.00–112.05 horizontal-line might confine its rise afterwards. In case of the pair’s sustained up-moves above 112.05, the 112.35, the 112.50 and the 112.75 may entertain the Bulls.
AUD/USD
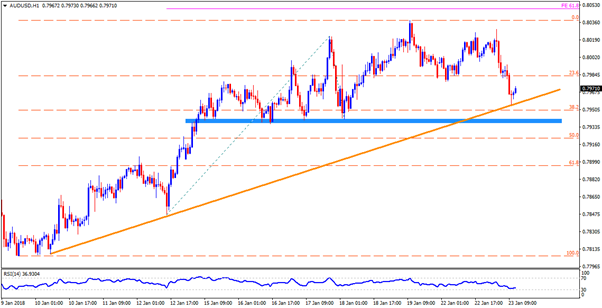
AUDUSD recently took a U-turn from adjacent TL support and can revisit the 0.8000 round-figure; though, the pair’s additional upside might find it hard to clear the 0.8025 resistance, breaking which it can rise to 0.8040 and then to the 61.8% FE level of 0.8050. During the pair’s successful trading above 0.8050, the 0.8065, the 0.8100 and the 0.8125 can be flashed in Buyers’ radar to target. Alternatively, break of 0.7955 TL support can fetch the quote to 0.7940-35 area, which if broken could mark 0.7915 and the 0.7900 levels on the chart. Once the pair starts respecting 0.7900 as strong resistance, it can meet the 0.7860 and the 0.7830 supports.
USD/CAD
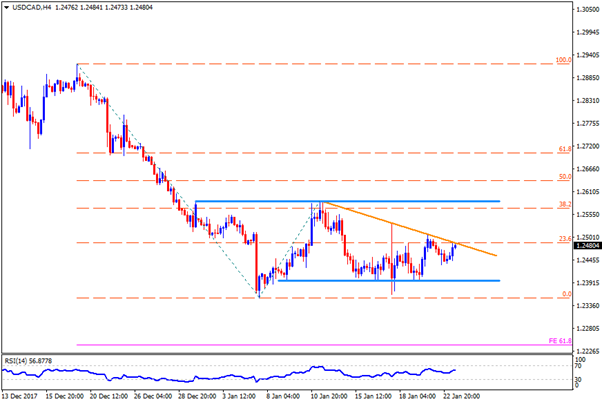
With the short-term descending trend-line limiting the USDCAD’s upside around 1.2485, chances of the pair’s pullback to 1.2430 become brighter. However, the 1.2400 horizontal-line and the 1.2355 may question the quote’s weakness after 1.2430, which if not respected can highlight 61.8% FE level of 1.2240 as strong support. Given the pair’s ability to surpass the 1.2485 trend-line resistance, the 1.2500 and the 1.2555 may please the buyers while 1.2580-90 may try disappointing them. Should prices keep increasing after 1.2590, the 1.2630, the 1.2685 and the 1.2700 are likely consecutive upside numbers to watch.
Cheers and Safe Trading,
Anil Panchal
About the Author
Anil Panchalauthor
An MBA (Finance) degree holder with more than five years of experience in tracking the global Forex market. His expertise lies in fundamental analysis but he does not give up on technical aspects in order to identify profitable trade opportunities.
Did you find this article useful?
Latest news and analysis


Advertisement