
Advertisement
Advertisement
E-mini Dow Jones Industrial Average (YM) Futures Analysis – Weekly Chart Bullish Over 25310, Bearish Under 24775
By:
Based on last week’s close at 25236 and the price action, the direction of the Dow this week is likely to be determined by trader reaction to the Fibonacci level at 25310.

March E-mini Dow Jones Industrial Average futures settled higher last week, but inside yesterday’s range. The chart pattern suggests investor indecision and impending volatility.
Weekly Technical Analysis
The main trend is down according to the daily swing, however, the Dow is currently in a position to shift momentum to the upside.
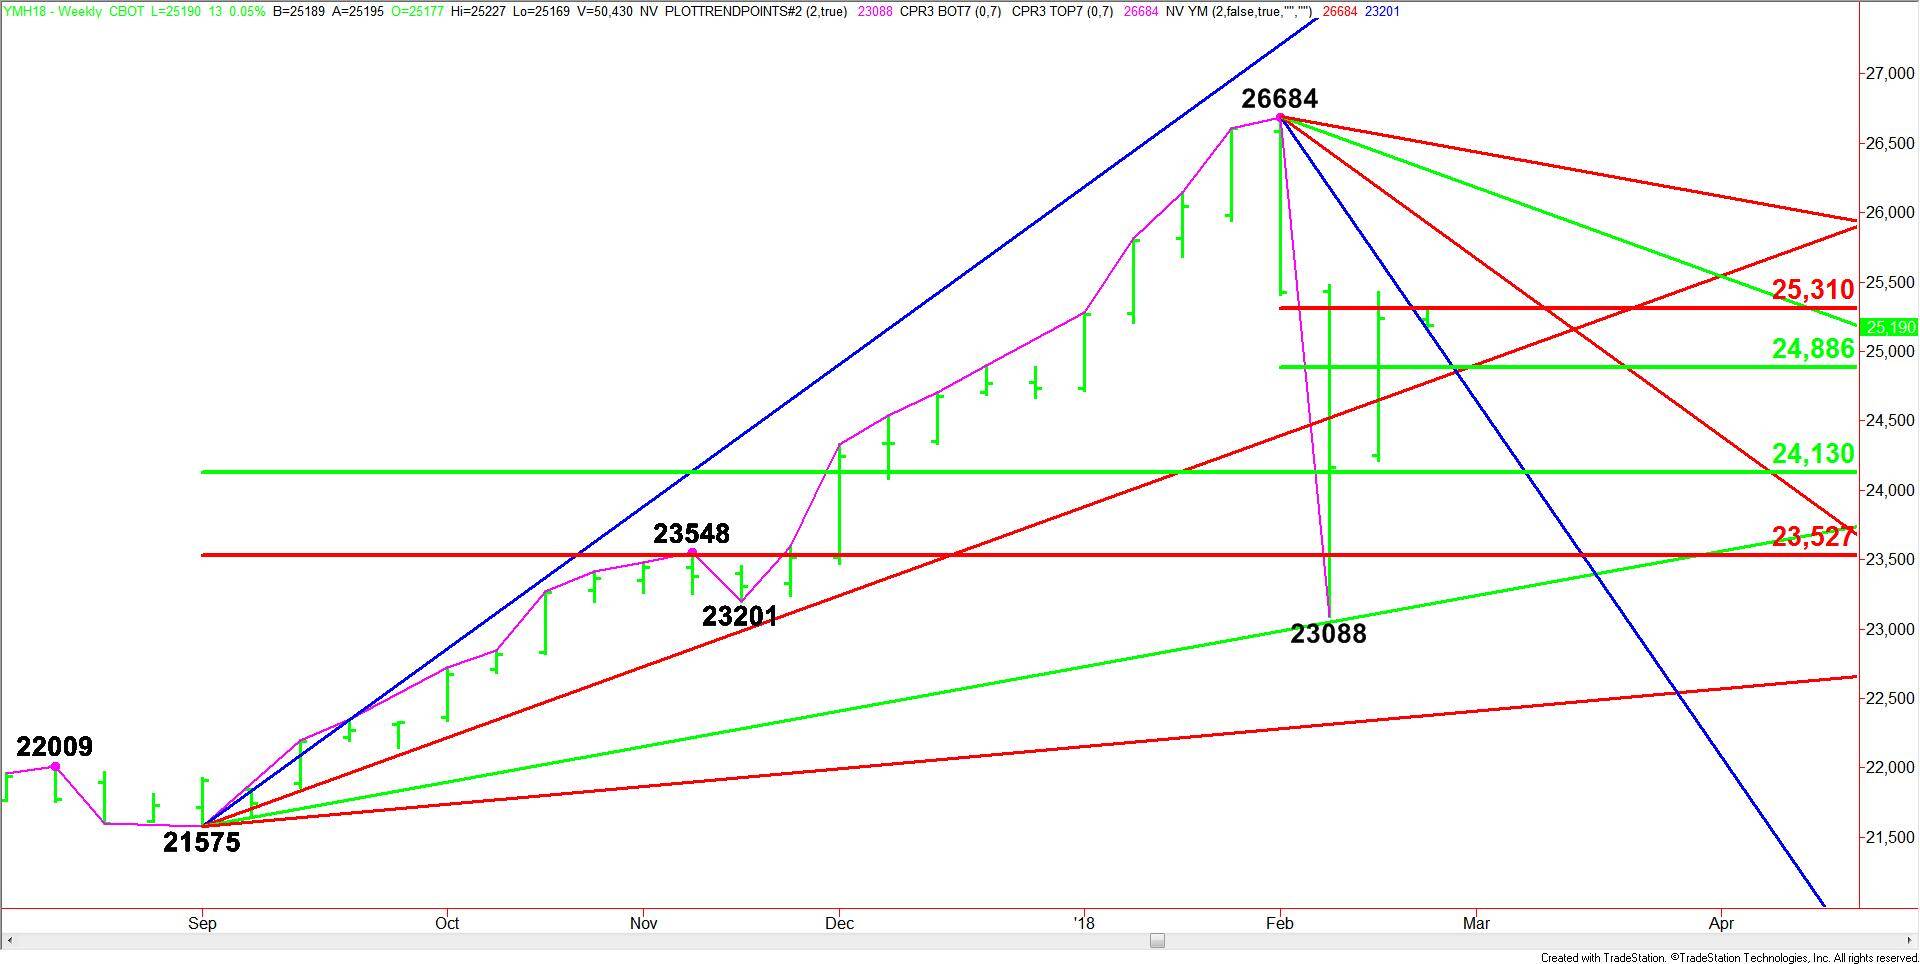
A trade through 26684 will negate the weekly closing price reversal top and signal a resumption of the uptrend.
A move through 23088 will signal a resumption of the downtrend.
The main range is 21575 to 26684. Its retracement zone at 24130 to 23527 is the primary downside target and nearest support. This zone is controlling the longer-term direction of the market.
The short-term range is 26684 to 23088. Its retracement zone is 24886 to 25310. Overtaking this zone will shift momentum to the upside. In the process, this zone will become support.
Weekly Technical Forecast
Based on last week’s close at 25236 and the price action, the direction of the Dow this week is likely to be determined by trader reaction to the Fibonacci level at 25310.
A sustained move over 25310 will indicate the presence of buyers. This could trigger an acceleration to the upside with a downtrending Gann angle at 25916 the first upside target. The Dow could continue to climb over this angle with additional targets coming in at 26300 and 26492. The latter is the last potential resistance angle before the 26684 main top.
This week’s support is clustered at 24886 to 24775. Crossing to the weak side of the uptrending Gann angle at 24775 will signal the presence of sellers. The daily chart is wide open under this angle with 24130 the next downside target. This is also the trigger point for an acceleration into 23527.
If 23527 fails as support then look for a further decline into 23175 then 23088.
About the Author
James Hyerczykauthor
James is a Florida-based technical analyst, market researcher, educator and trader with 35+ years of experience. He is an expert in the area of patterns, price and time analysis as it applies to futures, Forex, and stocks.
Did you find this article useful?
Latest news and analysis


Advertisement