
Advertisement
Advertisement
Technical Outlook of Important NZD Pairs: 21.02.2018
By:
NZD/USD With the 0.7430-40 area again playing its role in restricting the NZDUSD’s upside, the pair seems coming down towards 0.7275 but the eleven-week

NZD/USD
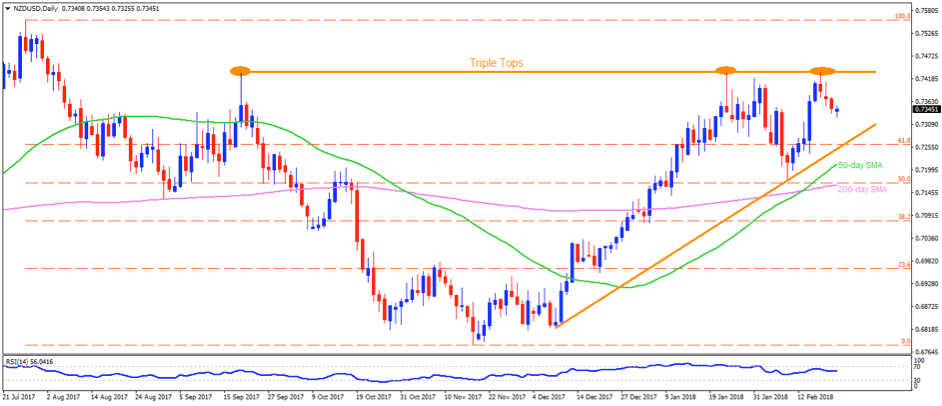
With the 0.7430-40 area again playing its role in restricting the NZDUSD’s upside, the pair seems coming down towards 0.7275 but the eleven-week long ascending trend-line, around 0.7250 now, might confine its declines then after. Should the quote refrains to respect the TL support, the 50-day SMA level of 0.7210 and the 0.7160, comprising 200-day SMA, could please the Bears. Meanwhile, the 0.7360 and the 0.7400 may try to limit the pair’s near-term advances before reigniting the importance of 0.7430-40 area. In case if Bulls manage to conquer the 0.7440 on a daily closing basis, the 0.7480, the 0.7525-30 and the 0.7560 should appear in their radars to target.
EUR/NZD
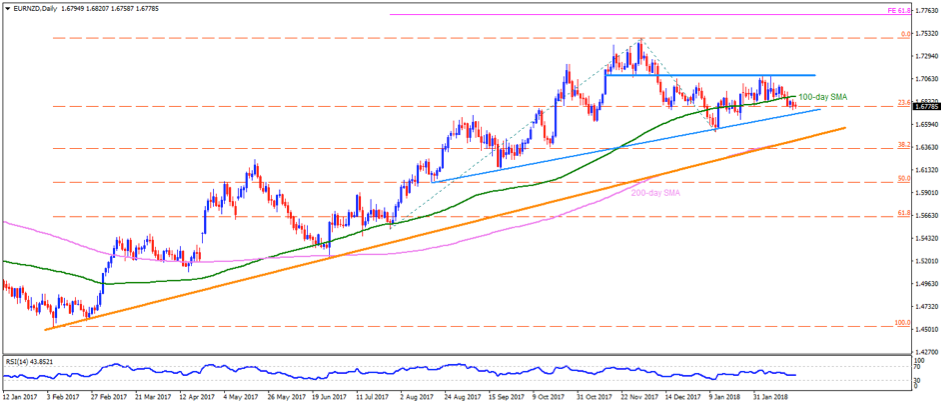
EURNZD’s sustained trading beneath the 100-day SMA level indicates brighter chances for the pair’s dip to six-month old upward slanting TL support of 1.6710. However, its south-run below 1.6710 has limited scope, but if happens could flash 1.6625 and the 1.6510 ahead of pushing sellers to aim for 1.6420 support-confluence, including 200-day SMA and more than a year long ascending trend-line. On the upside, the 1.6850 can act as immediate resistances for the pair prior to making it confront the 100-day SMA level of 1.6890 and then to the 1.7000 round-figure. Given the pair’s successful trading beyond 1.7000, the 1.7090–1.7100 horizontal-line becomes crucial to watch, breaking which the 1.7210 and the 1.7260 could entertain the buyers.
GBP/NZD
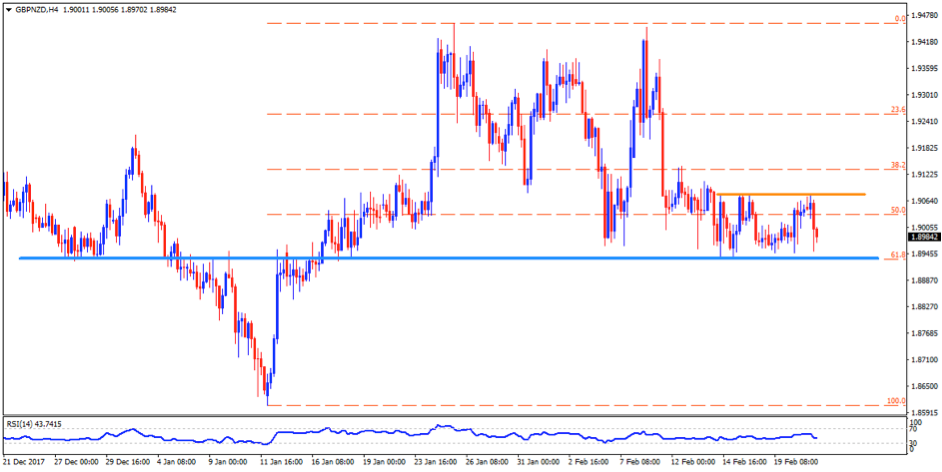
It’s been nearly a week that GBPNZD is clubbed in a small range between 1.9075-80 and the 1.8940-30. At present, prices are likely rushing towards the range support, i.e. 1.8940-30 zone, but higher than forecast UK Unemployment Rate may fetch them below the 1.8930, which in-turn could trigger the pair’s fresh south-run to 1.8860 and then to the 1.8800 support-level. If the pair smashes the 1.8800 mark, the 1.8730, the 1.8700 and the 1.8600 might come-back on the chart. Alternatively, the 1.9020 and the 1.9060 may pose as adjacent resistances for the pair, clearing which 1.9075-80 comes into play. Given the pair’s ability to surpass 1.9080, the 1.9100, the 1.9160 and the 1.9200 can please the optimists.
NZD/CAD
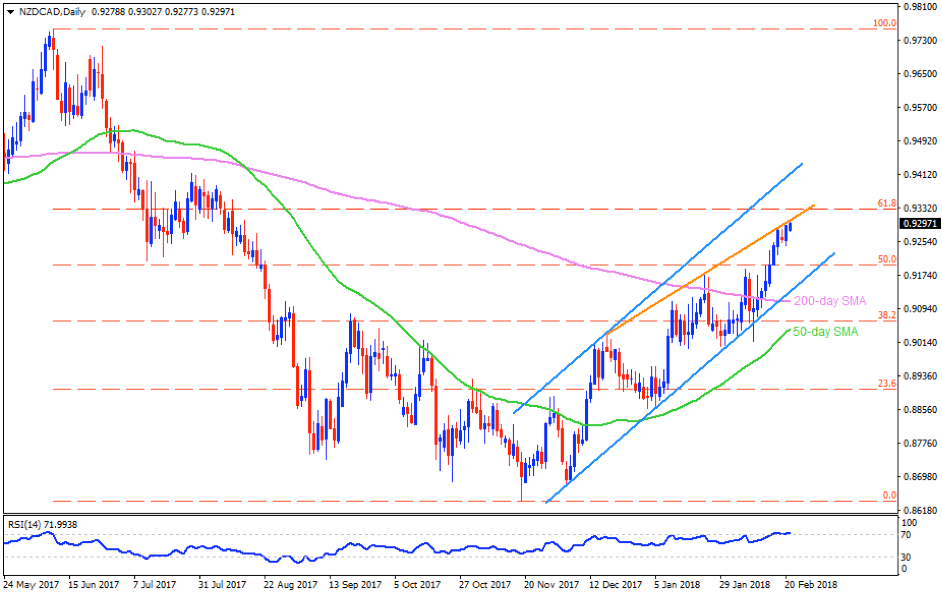
Even after testing the six-month high, the NZDCAD’s further advances might be capped by an ascending trend-line resistance, at 0.9305 now, which if broken could extend the pair’s rise in direction to 0.9355 and then to the channel-resistance of 0.9410. Assuming the pair’s successful break of 0.9410, the 0.9455 and the 0.9500 can be targeted while being long. Should overbought RSI performs its role and drag the pair downwards, the 0.9240 and the 0.9180 could gain traders’ attention, breaking which 0.9130, including channel-support, followed by 200-day SMA level of 0.9110, seem crucial to observe. Moreover, pair’s break of 0.9110, backed by a justification move-down beneath the 0.9100 round-figure on a daily closing basis, can recall 50-day SMA level of 0.9045 as a quote.
Cheers and Safe Trading,
Anil Panchal
About the Author
Anil Panchalauthor
An MBA (Finance) degree holder with more than five years of experience in tracking the global Forex market. His expertise lies in fundamental analysis but he does not give up on technical aspects in order to identify profitable trade opportunities.
Did you find this article useful?
Latest news and analysis


Advertisement