
S&P 500 Adam And Adam Double Bottom Pattern In Progress
(Click on image to enlarge)
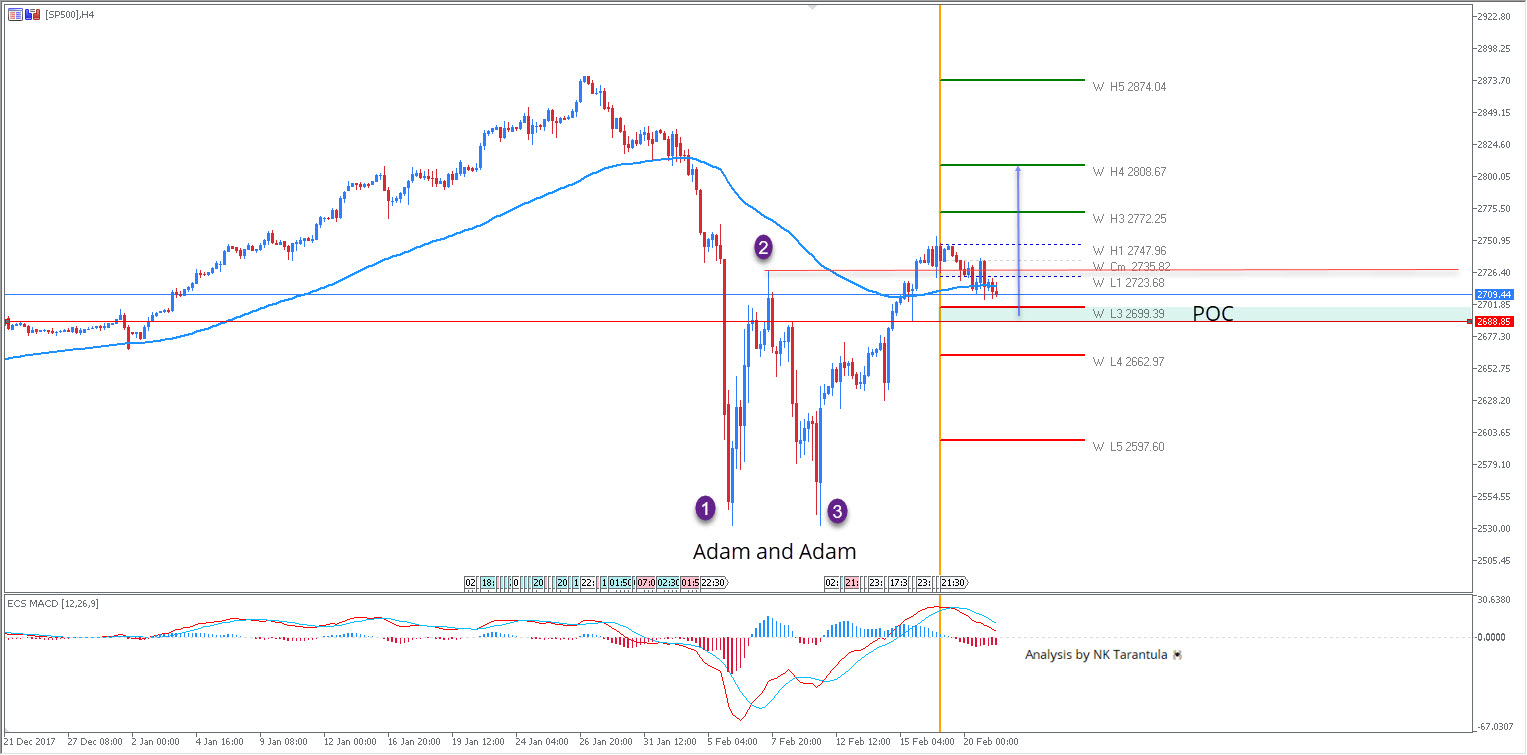
Source: Admiral Markets MT5 with MT5SE add-on
The SP500 has formed Adam and Adam double bottom pattern. Adam pattern is very similar to a W shaped reversal pattern except for the two related bullish spikes that distinguish the pattern from the W bullish. Point 1 and Point 3 form the basis while point 2 is a continuation point. The POC is formed within 2688-2700 zone and the price could spike from the zone towards 2727 (point 2). A 4h close above 2727 should target 2772 followed by 2808 on a further bullish momentum. Only below W L4 - 2662 the price might turn neutral again.
W H3 -Weekly Camarilla Pivot (Weekly Interim Resistance)
W L3 - Weekly Camarilla Pivot (Weekly Interim Support)
W H3 - Weekly Camarilla Pivot (Weekly Interim Resistance)
W H4 - Weekly Camarilla Pivot (Strong Weekly Resistance)
D H4 - Daily Camarilla Pivot (Very Strong Daily Resistance)
D L3 – Daily Camarilla Pivot (Daily Support)
D L4 – Daily H4 Camarilla (Very Strong Daily Support)
POC - Point Of Confluence (The zone where we expect price to react aka entry zone).
Disclaimer: Trading foreign exchange or contracts for differences on margin carries a high level of risk, and may not be suitable for all investors. There is a possibility that you may sustain a ...
more

