

Talking Points:
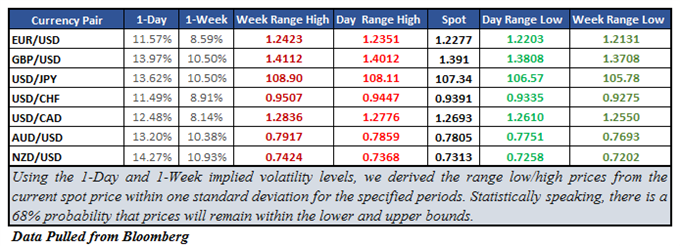
- NZD/USD one-day & one-week implied volatility are the highest of the majors
- The sentiment-linked currency still seems to be vulnerable to risk trends ahead
- Signs of reversing seem to be forming on the daily chart, confirmation is needed
See how the New Zealand Dollar is viewed by the trading community at the DailyFX Sentiment Page.
New Zealand Dollar options-derived volatility is hinting at more price action in the coming days. Looking at the table below, NZD/USD 1-day (1D) and 1-week (1W) implied volatility stand at 14.27% and 10.93% respectfully. In fact, the 1W measurement is at its highest in almost two weeks. These readings are also the most intense of the listed currency pairs.
Implied Volatility and Market Range
In the central bank spectrum, the RBNZ boasts one of the highest interest rates of the majors. This makes the New Zealand Dollar one of the more appealing currencies from a yield perspective. At the same time, this also leaves it vulnerable to risk trends when the mood in the market turns sour. And it sure did this month.
The surge in market volatility, which can be seen on the VIX, was a result of inflation fears that sparked selling in stock markets around the world. This was arguably triggered by the increase in US wage growth which was the highest since May 2009. Since then, things have cooled off but the New Zealand Dollar still looks to be vulnerable.
In fact, the 20-day correlation coefficient between NZD/USD and the S&P 500 stands around +0.70 and it has remained above zero since early December. Values close to 1 imply positive correlation while those approaching -1 mean inverse behavior. With that in mind, let’s see where the pair can go in the near-term.
NZD/USD Technical Analysis: Double Top in the Making?
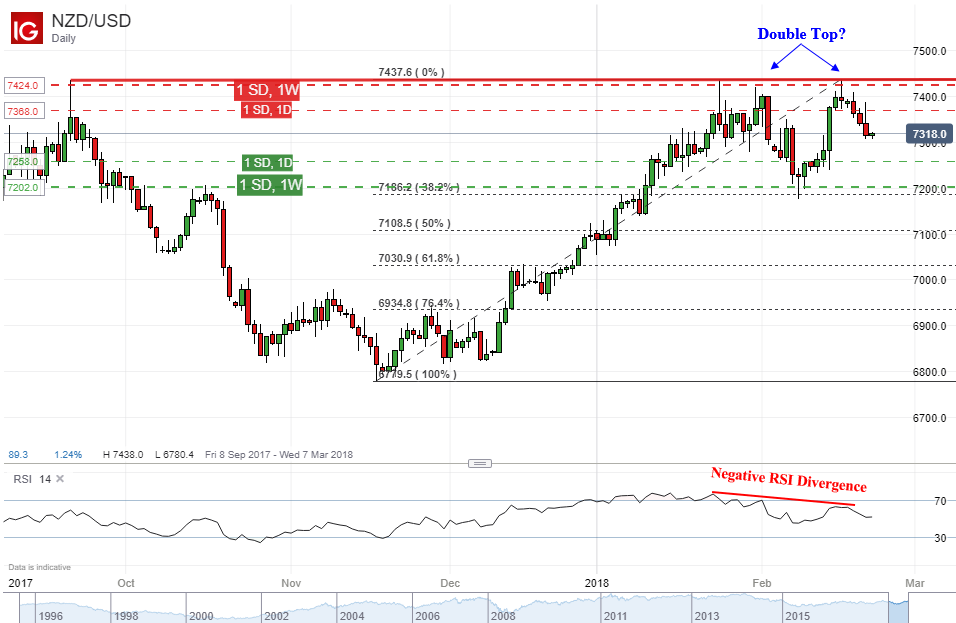
On a daily chart, NZD/USD is once again heading lower after what appears to be the formation of a double top. Prices were unable to budge above the September 20th high around 0.7435 once again. Simultaneously, negative RSI divergence implies that momentum to the upside is ebbing. Confirmation is needed though via a break below support to argue that the pair is turning lower for the worst.
A break below the “week range low” around 0.7202 could be that confirmation. However, the 38.2% Fibonacci retracement at 0.7186 could still stand in the way of support almost immediately after. On the other hand, if NZD/USD pushes higher, there is a 68 percent probability that prices will remain within 0.7424 or the “week range high” in the days ahead. A climb above the September 20th high would negate the formation of the double top.
For other currency volatility-related articles please visit the Binaries page.