
Advertisement
Advertisement
Gold Price Futures (GC) Technical Analysis – Trading Inside Intermediate Retracement Zone
By:
Based on the current price action, the direction of the gold market the rest of the session is likely to be determined by trader reaction to the intermediate Fib level at $1330.20.

Gold futures turned higher on Thursday, putting the contract in a position to post its first gain in four trading sessions. Despite the turnaround, the market is still in a position to post its biggest weekly loss this year.
At 1704 GMT, April Comex gold futures are trading $1331.80, down $0.30 or -0.02%.
Gold turned lower when the U.S. Dollar reversed course, following a steep sell-off on Wednesday in reaction to hawkishly perceived Fed minutes from its January meeting. Since traders likely went short yesterday, today’s price action is probably being fueled by short-covering.
Daily Swing Chart Technical Analysis
The main trend is down according to the daily swing chart. However, momentum may be shifting to the upside because of today’s intraday minor reversal bottom.
If the market closes higher, it won’t signal a major reversal since they usually occur after 7 to 10 day sell-offs. This could be more of a relief rally rather than one that leads to a change in trend.
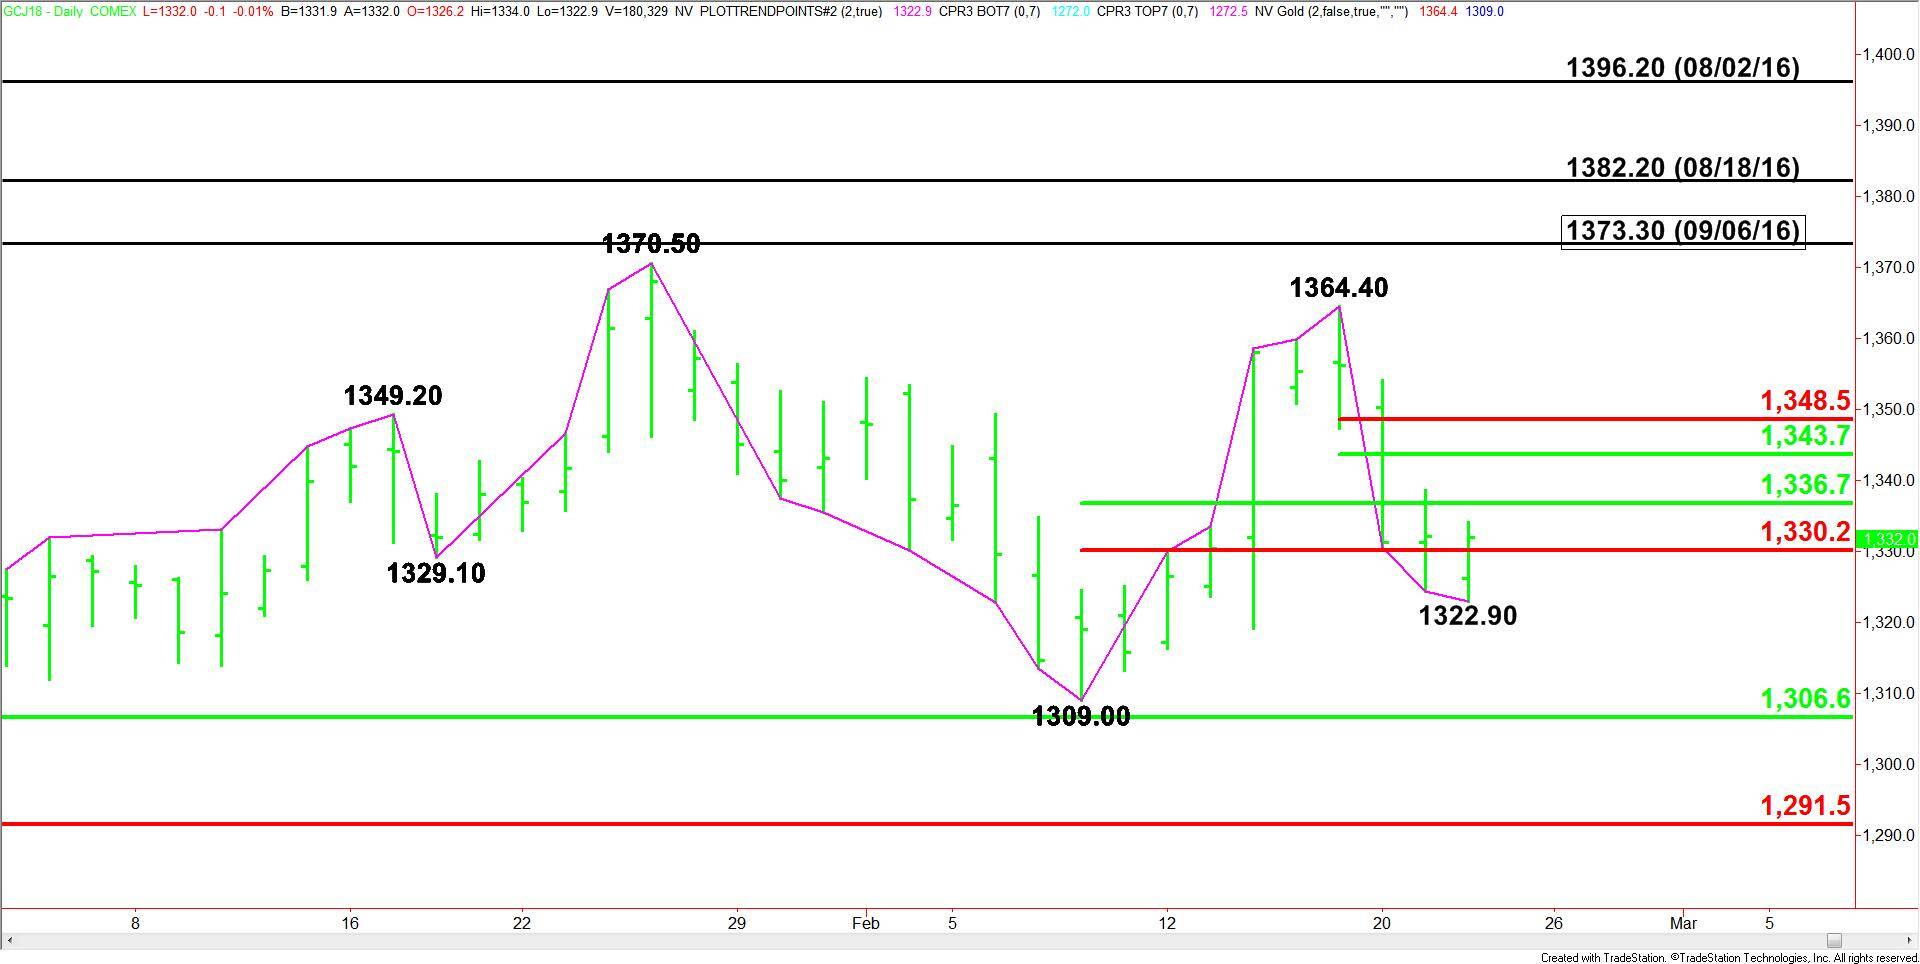
The trend will change to up on a move through $1364.40. A move through $1322.90 today will indicate the selling pressure is getting stronger. A move through $1309.00 will reaffirm the downtrend.
The primary downside target and major support is $1306.60 to $1291.50.
The intermediate range is $1370.50 to $1309.00. Its retracement zone at $1336.70 to $1330.20 is currently being tested.
The short-term range is $1364.40 to $1322.90. If the short-covering rally gains traction then its retracement zone at $1343.70 to $1348.50 will become the primary upside target.
Daily Swing Chart Technical Forecast
Based on the current price action, the direction of the gold market the rest of the session is likely to be determined by trader reaction to the intermediate Fib level at $1330.20.
A sustained move over $1330.20 will indicate the presence of buyers. This could trigger a labored rally with potential upside targets at $1336.70, $1343.70 and $1348.50. Since the main trend is down, any of these levels are capable of attracting sellers.
A sustained move under $1330.20 will signal the return of sellers. This could lead to a retest of the intraday low at $1322.90. This is a potential trigger point for an acceleration into $1309.00, followed by $1306.60.
About the Author
James Hyerczykauthor
James is a Florida-based technical analyst, market researcher, educator and trader with 35+ years of experience. He is an expert in the area of patterns, price and time analysis as it applies to futures, Forex, and stocks.
Did you find this article useful?
Latest news and analysis


Advertisement