


Bitcoin News and Talking Points
- Bitcoin sell-off nears robust support zone. Failure to hold will see losses deepen.
- Recent down-trend line respected so far.
Bitcoin (BTC) Price – Important Support Zone in Play
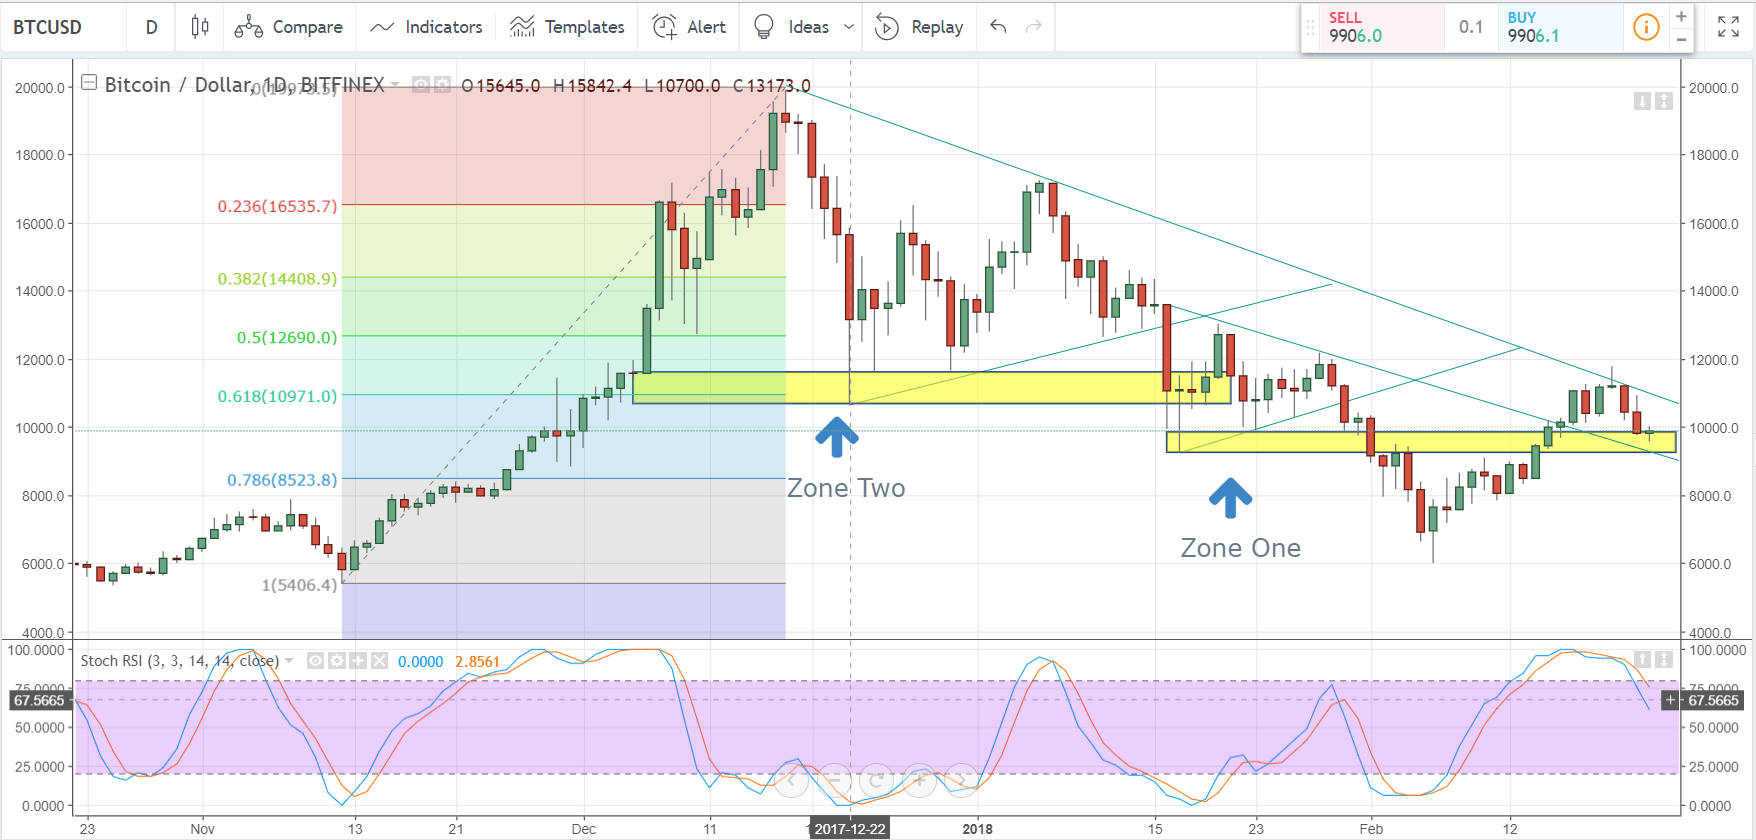
The latest cryptocurrency sell-off has seen Bitcoin give back its recent pull-back gains and enter a resistance zone which needs to hold if further short-term gains are to be made. After making a series of bullish positive ‘higher lows’ in the last two weeks, BTC has reversed and is currently making its forth ‘lower high’ in a row, a bearish market indicator. The largest digital coin has now entered a notable zone of resistance between $9,900 and $9,300 made up of a series of lows since early-December. The lower part of the zone also crosses with the recent downtrend channel, adding to the areas technical importance.
A move and close below $9,300 would open up the way to the next support level provided by the 78.6% Fibonacci retracement level at $8,523 ahead of the February 6 low of $6,000.
If resistance holds, and the current run of lower highs is broken, then Bitcoin could test a cluster of resistance levels between $10,600 and $10,970. A break above here would also see the downtrend broken, potentially opening the way for further gains.
We discuss a range of cryptocurrency charts and price set-ups at our Weekly Cryptocurrency Webinar every Wednesday at 12:00 GMT.
Bitcoin (BTC) Price Chart in US Dollars(October 22, 2017– February 23, 2018)
Cryptocurrency Trader Resources – Free Practice Trading Accounts, Guides, Sentiment Indicators and Webinars
If you are interested in trading Bitcoin, Bitcoin Cash or Ethereum we can offer you a wide range of free resources to help you. We have an Introduction to Bitcoin Trading Guide. In addition we run a Weekly Bitcoin Webinar and have an IG Bitcoin Sentiment Indicator to help you gauge the market and make more informed trading decisions.
--- Written by Nick Cawley, Analyst.
To contact Nick, email him at nicholas.cawley@ig.com
Follow Nick on Twitter @nickcawley1


