


Fundamental Forecast for USOIL: Bullish
Talking Points:
- OPEC member al-Mazrouei airs desire for long-term alliance of OPEC+ to stabilize market
- Per BHI, U.S. Oil Rig Count rises by 1 to 799, fifth straight weekly increase
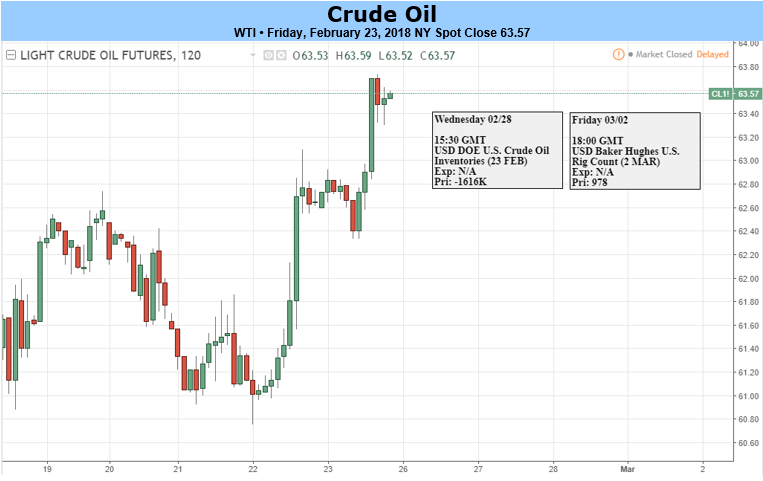
- EIA Crude Oil Inventory Data shows further draw of 1.61m barrels and surging exports
- IGCS showing net-short retail positioning in WTI - US Oil, favoring upside
After this week’s EIA Crude Oil Inventory Report and International Petroleum Week come to a close, Shale Oil producers in the US are looking pretty smart. Shale Oil producers took advantage of surging demand by ramping up production, which has been confirmed as a wise moving after surging Oil export data showed 2 million barrels a day leaving the US for the second time ever.
Exports hold a +0.564 correlation to the price of WTI Crude Oil’s front-month contract and helps explain the stubborn backwardation that continues to support price gains. Backwardation arises when a front-month futures contract demands a premium to later-dated contracts showing supply shortages and increasing demand.
The price of Crude Oil traded to the highest level in two weeks on dropping crude oil supplies to the tune of 1,617 thousand barrels marking the largest draw in five weeks. Another show of Oil market support was that the nation’s main storage facility in Cushing, Oklahoma fell to the lowest since 2014 as oil gets pushed to the Gulf Coast.
Over the last 12-months, US Crude Oil inventories have fallen by 34.23% as persistent stockpile drawdowns are no match for the often feared US Supply. As mentioned in FX Closing Bell on Thursday, Bears are often simply looking at one side of the problem instead of the other side that may be the solution to the oil market.
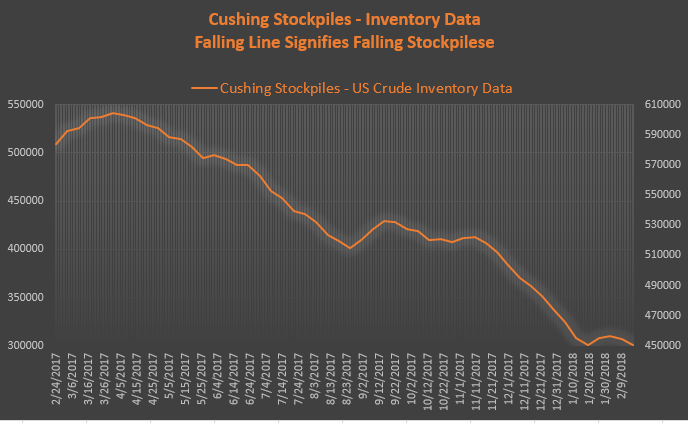
Data Source: Bloomberg, Chart created by Tyler Yell, CMT
There’s a global rise in oil demand! Click here to see our Q1 forecast on what outcomes we're watching!
Outside of the positive US inventory data was the outlook from the International Petroleum (IP) Week that also encouraged drillers to keep drilling. First, demand outlook remains strong but may lend to oil market volatility. However, likely more important in the long term is the hope that OPEC and Russia can come to a long-term agreement to continue to curb production beyond the current agreement. The idea was aired by Suhail al-Mazrouei, the energy minister of the United Arab Emirates and a rotating president of OPEC.
Mazrouei said in a Bloomberg TV interview that he is drafting a charter to ensure that OPEC and strategic alliances can work together going forward by default to help avoid future gluts, and in some cases, shortages. The draft is not expected to be made public anytime soon, but a key sign that an agreement is in the works will likely be signaled best by the significance of Russia’s initial investment in Saudi Aramco, the Saudi-Arabian state oil company that is listing their shares later this year. A large Russia stake could signal a long-term alliance that seeks the support of Oil prices, and therefore, Aramco margins.
Technical Focus for Crude Oil – Bullish Resumption
The technical focus on WTI Crude Oil remains at $63.62 as resistance, the January 30 low. However, Bulls of WTI Crude are seeing oil trade at a gain for the year again after a 2.5% rise in the week heading into Friday trading. An ability for WTI Crude Oil to break and close above $63.50 would align and favor a strong back to the 2018 high of $66.59/bbl.
Traders were likely encouraged by WTI’s front-month contract trading above the 50-DMA on a closing basis this week, currently at $61.63/bbl while backwardation extended back to the YTD high of $4.87 on the Dec18-Dec19 spread.
A move above $63.62 would align with a Bullish breakout per the Ichimoku cloud, which has been applied to the Crude Oil chart. Conversely, a break and close below $58.07, the February low would open up the potential for a much deeper reversal toward the 50% retracement at $54.34 or the 61.8% retracement at $51.44.
Learn how to utilize Ichimoku Cloud in our FREE guide here
If you want to see Ichimoku Analysis in action, check out my new report, Ichimoku Charts that Matter
Crude Oil Price Surges Off Higher Low, Ichimoku Cloud
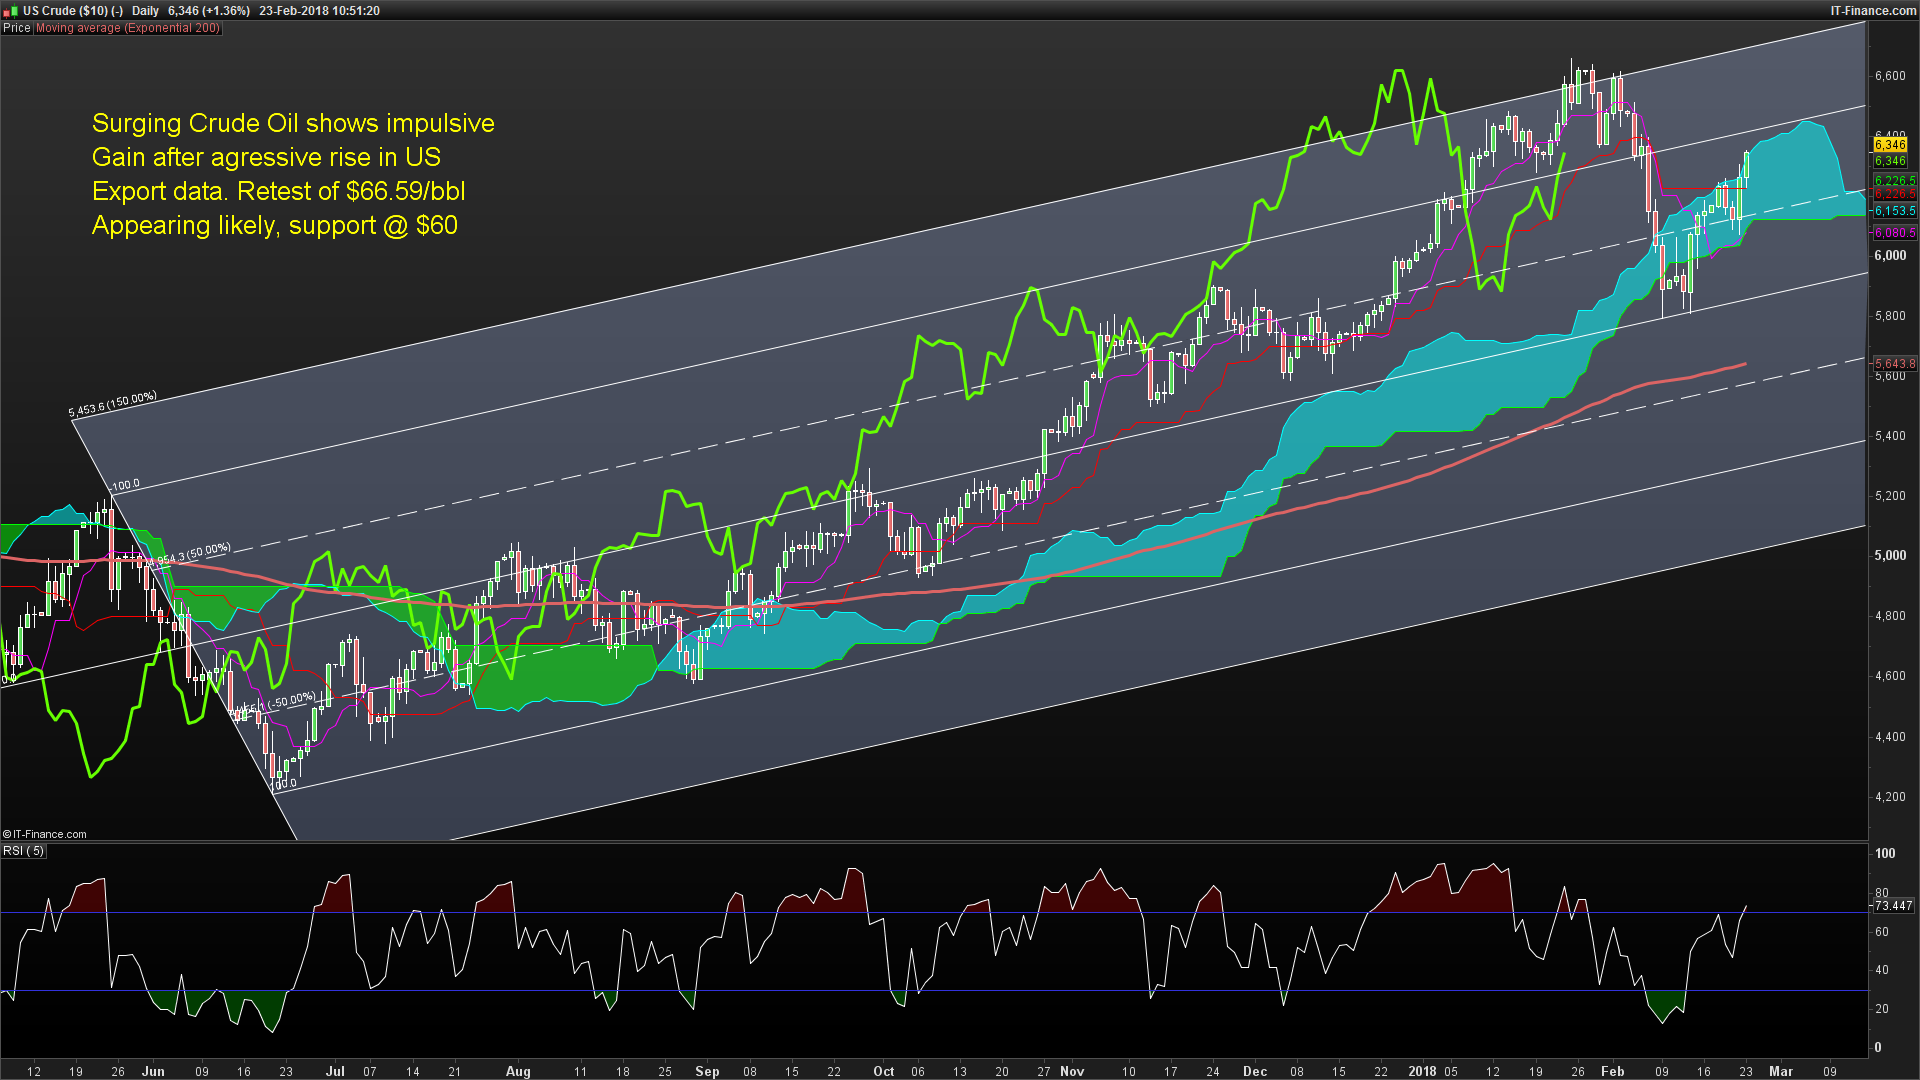
Chart Created by Tyler Yell, CMT
Next Week’s Data Points That May Affect Energy Markets:
The fundamental focal points for the energy market next week:
- Tuesday 09:30 AM Tokyo time: Japan’s Ministry of Finance releases country’s fuel imports for Jan.
- Tuesday 04:30 PM ET: API issues weekly US Oil Inventory report
- Wednesday 10:00 AM ET: Fed Chairman Jerome Powell testifies before House Financial Services Committee
- Wednesday 10:30 AM ET: EIA issues weekly US Oil Inventory Report
- Wednesday 12:00 PM ET: EIA releases its monthly supply report
- Fridays 1:00 PM ET: Baker-Hughes Rig Count at
- Friday 3:30 PM ET: Release of the CFTC weekly commitments of traders report on U.S. futures, options contracts
Crude Oil Insight from IG UK Client Sentiment:: Contrarian view of retail positioning favors upside
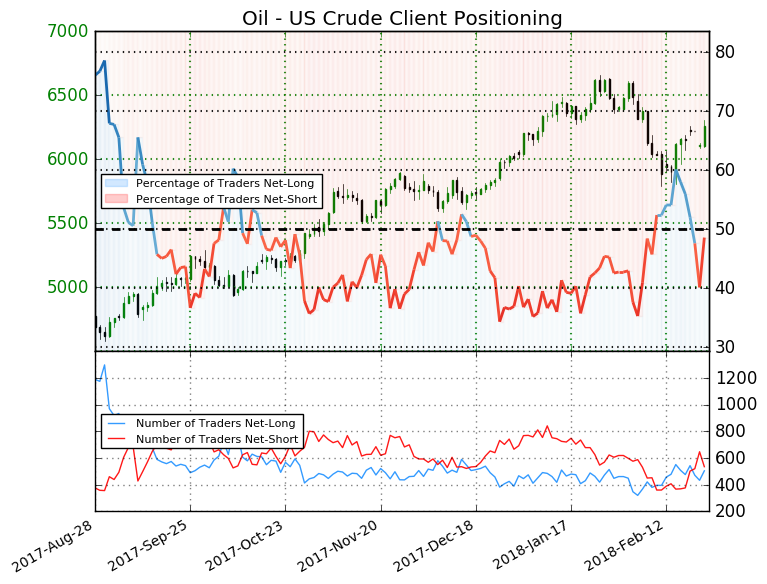
We typically take a contrarian view to crowd sentiment, and the fact traders are net-short suggests Oil - US Crude prices may continue to rise. Positioning is less net-short than yesterday but more net-short from last week. The combination of current sentiment and recent changes gives us a further mixed Oil - US Crude trading bias.
Discuss this or other markets you’re trading with me below!
-TY


