Fundamental Factors Focus:
- US optimism peaking, which may mean the risky asset rally has further to run
- Aggressive supply of base metals, energy is increasingly dependent on global demand picture
- Signs of a ‘dollar shortage’ that aligns with risk off markets remain absent
Capital flows, business activity, a premium of borrowing costs, and consumer confidence are foundational components of an economy that sees investors rushing into risky assets, and shying away from investments that don’t capture the upside.
Optimism Reigns Stateside
Two data points have recently moved to extremes not seen since the kick-off of the Regan economic boom in the early 1980s that saw interest rates and inflation drop alongside tax cuts enacted that boosted confidence and productivity.
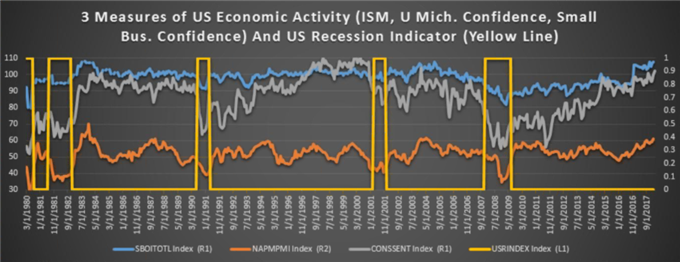
3 Measures Of Economic Activities Hitting Multi-Cycle Highs, Recession Unlikely

Data source: Bloomberg, Chart created by Tyler Yell, CMT
The first data point, the Institute for Supply Management (ISM) Manufacturing Business Survey just aligned with the NFIB small business optimism index to hit levels not seen in years. For the Small Business Optimism Index, it recently reached the highest level since 1983 where the ISM hit a 13-year high last month.
Friday morning also saw a 14-year high of the University of Michigan Consumer Confidence reading with an all-time high with the current conditions gauge that measures American’s perception of their personal finances hitting an all-time high.
What is worth noting in both cases is that both in the early 80s, and ISM in May 2004 was seen at the early- to mid-point of an economic expansion. Should a similar development be in place, traders should keep their low-probability high-impact scenarios saved for their NCAA March Madness Brackets, and the high-probability mid-impact events applied to investing.
In other words, and as I argue in Ichimoku Charts that Matter, shocks tend to happen in the direction of the trend. Rallies typically don’t end with a bang opposing extreme optimism like we see now, but rather, rallies tend to rollover, and the sharp downside moves that make headlines that turn into a bear market often come off a bad news crescendo when investors tend to sell first, and ask questions later.
Currently, we seem to be far away from a rollover as optimism reigns supreme. Also, aside from the 2001/2 recession, peaks in confidence tend to happen early- to mid-cycle favoring an extension of the current risky-asset buying environment.
Unfamiliar with Key FX Fundamental Factors to watch? No worries, I created a primer for you here
You Can’t Have Demand without Optimism, and Demand Is up per Oil Data
Two stories in the commodity world that have come to surface in recent months is the aggressive supply of crude oil from US shale producers that is running counter to the plans of OPEC and strategic alliance like Russia to reduce the supply glut.
Another focus has been on supply from China regarding steel and aluminum. The supply remained uncomfortably high for many despite the winter production curbs and enforced reduction and in some cases, halting of supply from ‘rogue’ metal suppliers. The trade tariff’s from US President Trump appear squared on China and Europe, and could cause the supply from China to not be adequately absorbed, and may put pressure on prices if optimism and demand do not stay supported.
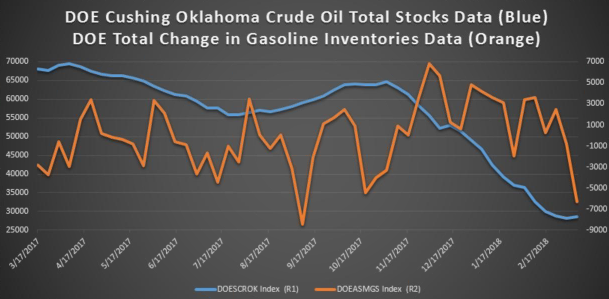
However, in Crude’s case, at least when looking at IEA projections, demand is making the aggressive supply coming online be quickly absorbed. The monthly IEA report predicted a widening supply deficit forming later this year due to the decline in Venezuela’s Oil Production due to their own economic turmoil. The IEA forecast could mean that the global oil inventory surplus would disappear in H2 2018.
While demand is exciting in the short-term, supply is often stickier. Suppliers tend to look at their supply as prophetic, and a fall of demand is often seen, and hoped to be temporary. That is the pickle that global oil producers found themselves in during the 2013-2014 supply build up as demand fell-off and eventually sent Brent Oil to $30/bbl, before a sharp bounce took in early 2016.
Crude Oil And Crude Produce Stockpiles Continue To Fall On Higher Demand

Data source: Department of Energy, Bloomberg
Next Arrow in the Bull’s Quiver, No Dollar Shortage in Sight

Data Source: Bloomberg
Out of the gates of the Great Financial Crisis was a sharp inverse correlation between the US Dollar and riskier asset price levels. A large factor in this development was the view that there was a US Dollar shortage and demand for haven assets as investors remained unsure of the sustainability of the feeble recovery.
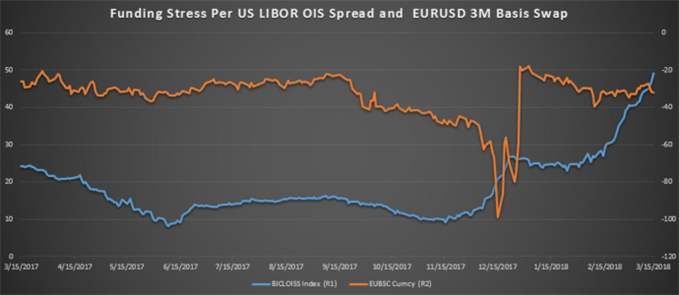
One of the metrics looked at in the financial market is sometimes referred to as the market’s plumbing or liquidity around the reserve currency, the US Dollar. The market that is utilized to see ‘funding stress’ or a ‘dollar shortage’ is the cross currency basis swap or when a currency from one investor is exchanged for another currency based on swap rates calculated from each country’s yield curve.
The chart above shows the rising LIBOR-OIS spread, which indicates a higher interbank borrowing cost over the implied Fed reference rate. While the spread is widening, stress that typically aligns with Dollar strength and a 'dollar shortage,' appears no where insight. The orange line shows the 3M EURUSD 3M cross currency basis swap with sharp downspikes showing funding stress. The lack of funding stress with the stable orange line means that traders looking for an aggressive dollar rally based on the shortage of USD argument could be waiting a while for their anticipated outcome to play out.
As a swap contract, there is no value on initiation, and the market value is based on demand for once currency or another. When looking at the EUR/USD or USD/JPY cross currency basis swap, you can see if a ‘dollar shortage’ is developing or whether they were plenty of dollar in the system such that the swap shows less of a demand for US Dollars.
Given the typical inverse correlation to the US Dollar and risky assets, a weaker dollar or lack of dollar supply like the chart above shows could mean that the risky asset rally has room to run as the other points make sense.
New to FX trading? No worries, we created this guide just for you.
---Written by Tyler Yell, CMT
Tyler Yell is a Chartered Market Technician. Tyler provides Technical analysis that is powered by fundamental factors on key markets as well as t1rading educational resources. Read more of Tyler’s Technical reports via his bio page.
Communicate with Tyler and have your shout below by posting in the comments area. Feel free to include your market views as well.
Discuss this market with Tyler in the live webinar, FX Closing Bell, Weekdays Monday-Thursday at 3 pm ET.
Talk markets on twitter @ForexYell
Join Tyler’s distribution list.


