
Above The 40 – A Sharp Edge Cuts A Churning Stock Market
AT40 = 42.9% of stocks are trading above their respective 40-day moving averages (DMAs) (traded as low as 37.6%)
AT200 = 47.9% of stocks are trading above their respective 200DMAs
VIX = 19.0 (traded as high as 21.9)
Short-term Trading Call: neutral
Commentary
In my last Above the 40 post, I described how the stock market stumbled its way to the sharp edge of critical support levels for the major indices. Today, the indices got cut. The screaming headlines included news about the abuse of Facebook data and more political drama from Washington, D.C., but I strongly suspect these events were just convenient excuses for sellers to sell. The reaction to the Facebook news, a large 4% gap down, likely cut the will of buyers in the first part of the day. If the stock market were more healthy, I bet few if any of the headlines would have mattered to the originally scheduled programming.
Yesterday, the S&P 500 (SPY) gapped down below its 50-day moving average (DMA) and lost 1.4% at the close. The Nasdaq gapped down below its upper-Bollinger Band (BB) uptrend channel and lost 1.8% on the close. At its low, the Nasdaq perfectly tapped its 50DMA. The PowerShares QQQ ETF (QQQ) did the same as the Nasdaq but lost 2.1% on the day.
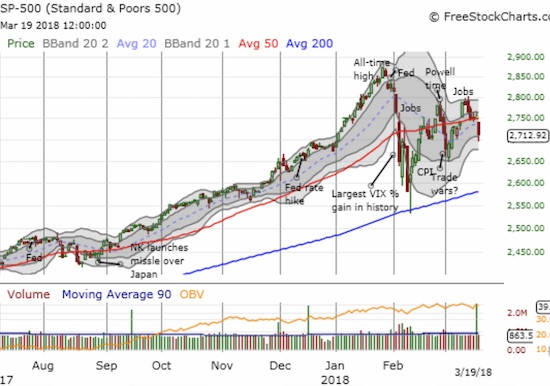
The S&P 500 (SPY) cut cleanly through its 50DMA support with a bearish gap down.
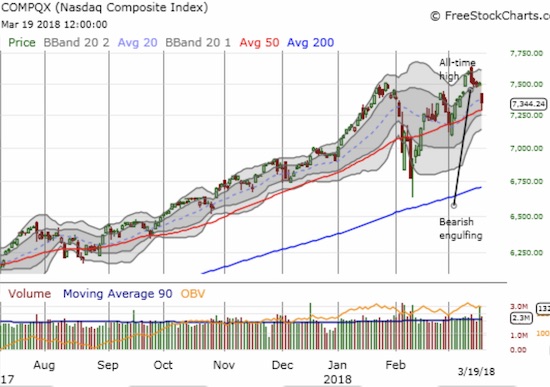
The Nasdaq found enough buyers to defend 50DMA support. Still, the gap down and 1.8% loss delivered a resounding confirming of last week’s bearish engulfing pattern.
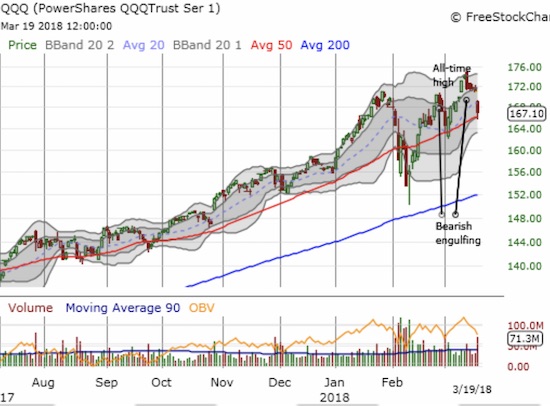
Bearish engulfing patterns have really made a statement on the PowerShares QQQ ETF (QQQ).
The iShares Russell 2000 ETF (IWM) once again out-performed the major indices. IWM bounced sharply off its 50DMA and closed with a loss of 1.0%.
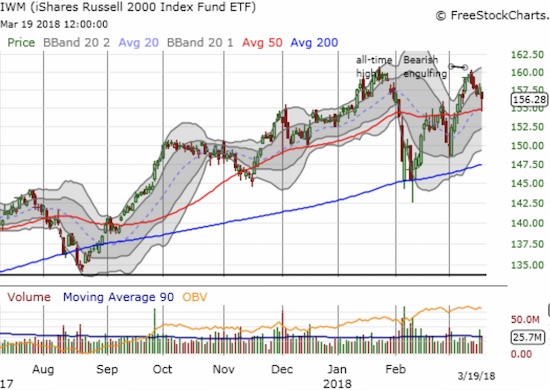
The iShares Russell 2000 ETF (IWM) confirmed its earlier bearish engulfing pattern. Still, buyers stepped up in force to bounce the index sharply off 50DMA support.
The bounces off intraday lows helped prop up AT40 (T2108), the percentage of stocks trading above their respective 40DMAs. AT40 dropped from 49.0% to 42.9% after trading as low as 37.6%. The volatility index, the VIX, faded sharply off its intraday high of 21.9 to end the day at 19.0. The 15.35 pivot now looks like a launching pad for this move. Based on the last two spikes in the VIX, I have to assume that near-term upside risk remains quite strong.
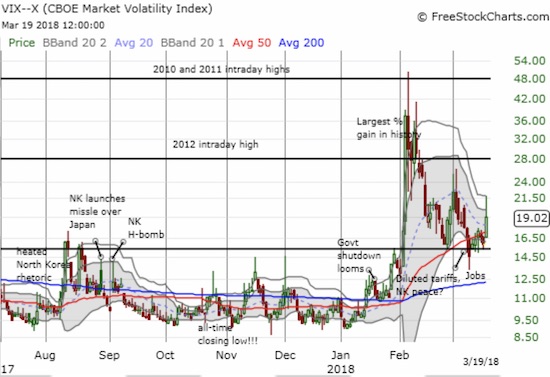
The volatility index, the VIX, launched away from the 15.35 pivot for a 20.4% gain.
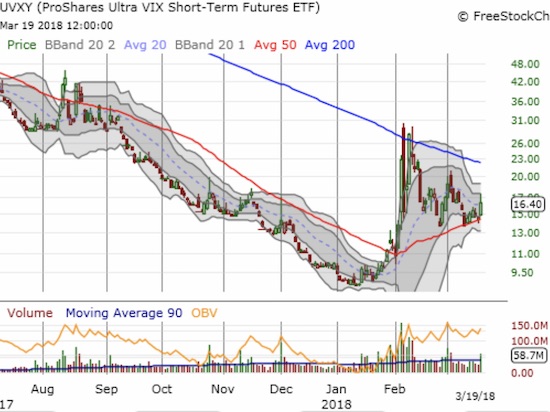
The ProShares Ultra VIX Short-Term Futures (UVXY) is showing off its own resilience by holding 50DMA support.
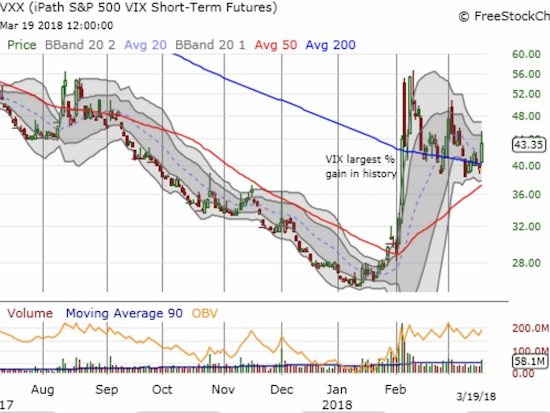
The iPath S&P 500 VIX ST Futures ETN (VXX) is showing resiliency as it clings to 200DMA support. Its 50DMA is quickly rising to converge and force the issue of the next big move.
I am not sure which side of the fence is getting more exhausted: the buyers or the sellers. What I do know is that I have grown weary of switching the short-term trading call in an attempt to keep up with what increasingly looks like an extended period of market churn. I have decided to stand down for now. Since the S&P 500 broke below its 50DMA support, I downgraded from bullish and went back to neutral. I plan to leave the trading call there until AT40 reaches its next extreme – oversold or overbought – and/or the S&P 500 breaks out to a new all-time high (bullish). This change acknowledges that AT40 has little to say when the stock market is in a period of churn. If the Nasdaq and/or QQQ joins the S&P 500 to trade below its 50DMA, I will be a little more receptive to the growls of the bears even with the short-term trading call stuck in neutral.
My trading response to today’s dramatic action was a bit layered, but I tried to be as systematic as possible…
Although the S&P 500’s gap down below its 50DMA support flipped me bearish, the Nasdaq trading above its 50DMA compelled me to buy some dips. So I pursued a dual strategy. I first took profits on QQQ puts (they were paired with QQQ calls) and added to my weekly AAPL calls (probably a long shot with today’s 1.5% loss). I proceeded to buy call options expiring next week for FB and Goldman Sachs (GS). Low ball orders to double down on FB executed but not on GS. FB is pure speculation that within a week or so the stock will be in a sharp recovery mode. GS is a trade that I assume will work after the Fed hikes rates. I bought an Alphabet (GOOG) call expiring this week. Finally, I loaded up on SPY put options and took profits during the East Coast lunch hour. A limit order to fade iPath S&P 500 VIX ST Futures ETN (VXX) executed right under the intraday high of the day. This trade is part of my plan to fade volatility spikes ahead of the Fed proclamation on monetary policy on Wednesday.
Since I am already sitting on plenty of long positions now, my new trades will likely favor shorts and puts until I switch the short-term trading call to bullish.
CHART REVIEWS
Chipotle Mexican Grill (CMG)
CMG has traded in an unusually tight range for the past month. Now, a double squeeze is on: its 50 and 200DMAs are converging and the Bollinger Bands (BBs) are pinching together into what looks like a growing BB-squeeze. I am looking to play the breakout or breakdown from this pattern.
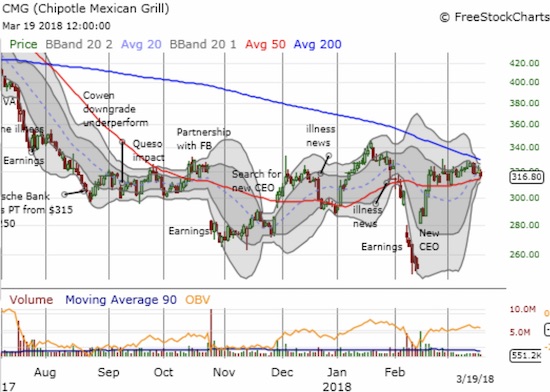
Chipotle Mexican Grill (CMG) looks like it is setting up for the next big move.
Facebook (FB)
I was quite surprised by the reaction in FB’s stock, but I guess the sellers were just looking for an excuse. The stock even cracked 50DMA support. Somehow, the stock gathered itself enough to close right on top of its 200DMA line of support. All eyes will be on FB trading for a while. As stated earlier, I am playing for a bounce in the next two weeks, but this trade is quite speculative. At the time of writing, news about the departure of FB’s head of cybersecurity sent the stock lower in after hours trading. Under the circumstances this seems to be a big deal, but it is something else FB will surely overcome in due time.
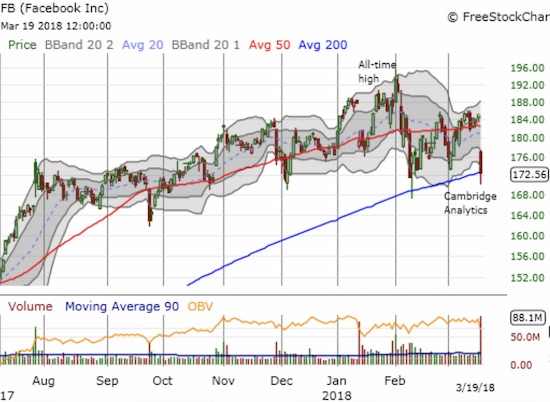
Facebook (FB) survived a test of 200DMA support during the February sell-off. Can it survive another one just a month later?
Equifax (EFX)
For good measure, I opened up a short position in EFX. This company was involved in a case of data abuse that far exceeds the scale and scope of FB, but the situation has almost entirely dropped off the radar. The stock made a valiant jump off its post-breach lows. Still, the declining 200DMA is delivering stiff resistance to any further advance. The stop-loss is a fresh post-breach high.
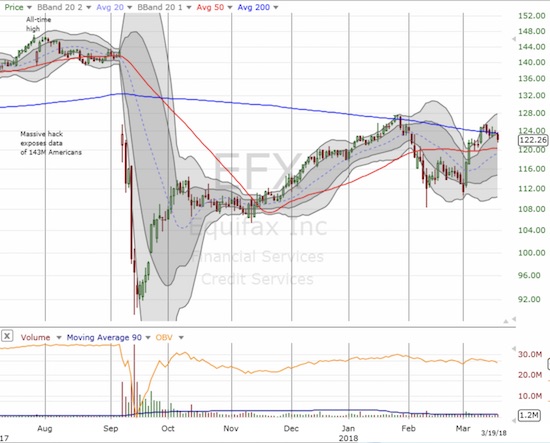
Equifax (EFX) took 4 months to recover 6 trading days worth of losses. Now the stock is on its second month of struggling with 200DMA resistance.
“Above the 40” uses the percentage of stocks trading above their respective 40-day moving averages (DMAs) to assess the technical health of the stock market and to identify extremes in market sentiment that are likely to reverse. Abbreviated as AT40, Above the 40 is an alternative label for “T2108” which was created by Worden. Learn more about T2108 on my T2108 Resource Page. AT200, or T2107, measures the percentage of stocks trading above their respective 200DMAs.
Active AT40 (T2108) periods: Day #22 over 20%, Day #11 over 30%, Day #7 over 40% (overperiod), Day #5 under 50%, Day #30 under 60%, Day #36 under 70%
Daily AT40 (T2108)

Black line: AT40 (T2108) (% measured on the right)
Red line: Overbought threshold (70%); Blue line: Oversold threshold (20%)
Weekly AT40 (T2108)

Disclosure: Long SPY shares and calls, short VXX, long FB calls, long GOOG call, long GS call.
Follow Dr. Duru’s commentary on financial markets via more


