- Crude oil jumps more than 2% on Tuesday as Middle-East tensions intensify.
- CAD/CHF is finding support at the 0.7250 level.
The CAD/CHF is currently trading at around 0.73169 up 0.63% on Tuesday as the CAD is gaining some strength with crude oil prices soaring more than 2% on Tuesday and breaking out of a triangle pattern which has been more than two months in the makings. Additionally, Canada is not affected by the US tariffs on steel and aluminum which is a relatively favorable point for the currency. Last week, Bank of Canada’s Poloz said that “monetary policy remains particularly data-dependent” and “BoC cannot take a mechanical approach to policy, even though interest rates likely to move higher over time”.
Coming next on the macro front for the CAD is Deputy Governor C. Wilkins scheduled to speak on Thursday at 18.45 GMT. Retail sales and CPI inflation data are due on Friday at 12.30 and the news is likely to generate volatility in the currency markets.
The Swiss National Bank Quarterly Bulleting is scheduled on Wednesday at 14.00 GMT and no big surprises should shake the market accrding to analysts.
Earlier in the European session, the market seemed to have largely ignored the Swiss State Secretariat for Economic Affairs (SECO's) latest quarterly economic forecasts which upgraded 2018 Swiss GDP to 2.4% from 2.3% previously and 2019 GDP seen at 2.0%, prior forecast 1.9.
CAD/CHF weekly chart
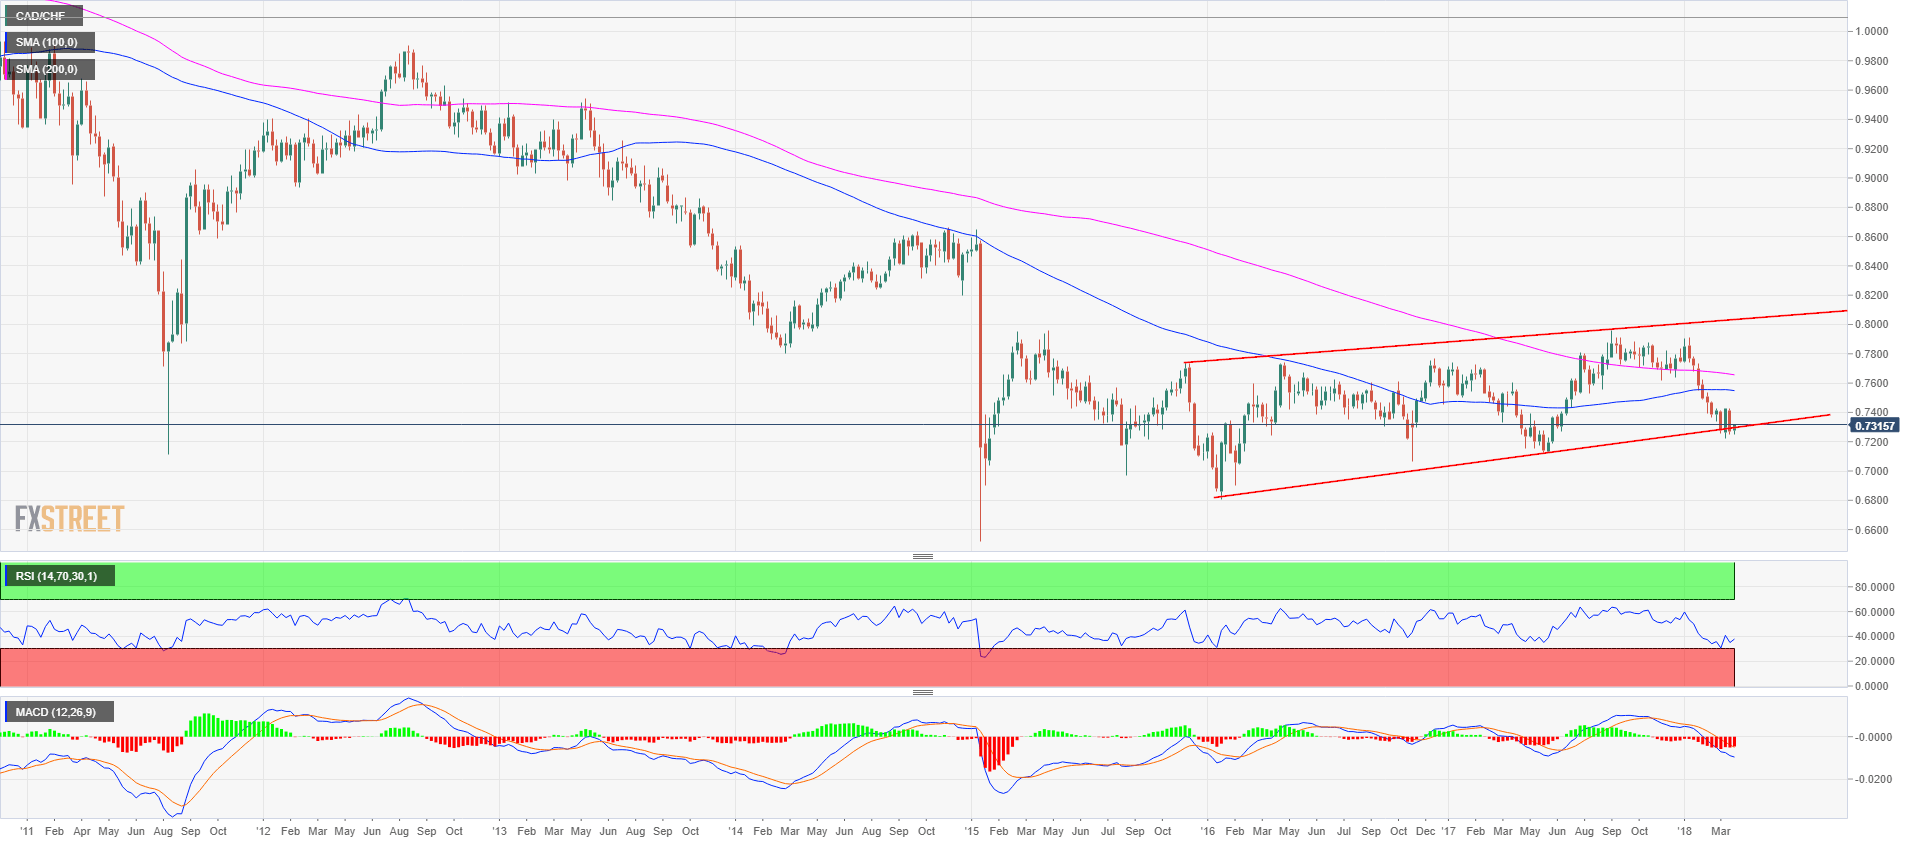
The CAD/CHF cross is now in its fourth week of trading range bouncing between the 0.7200 and 0.7400 figures. While the RSI is showing some positive divergence the MACD is still indicating a bearish trend.
CAD/CHF daily chart
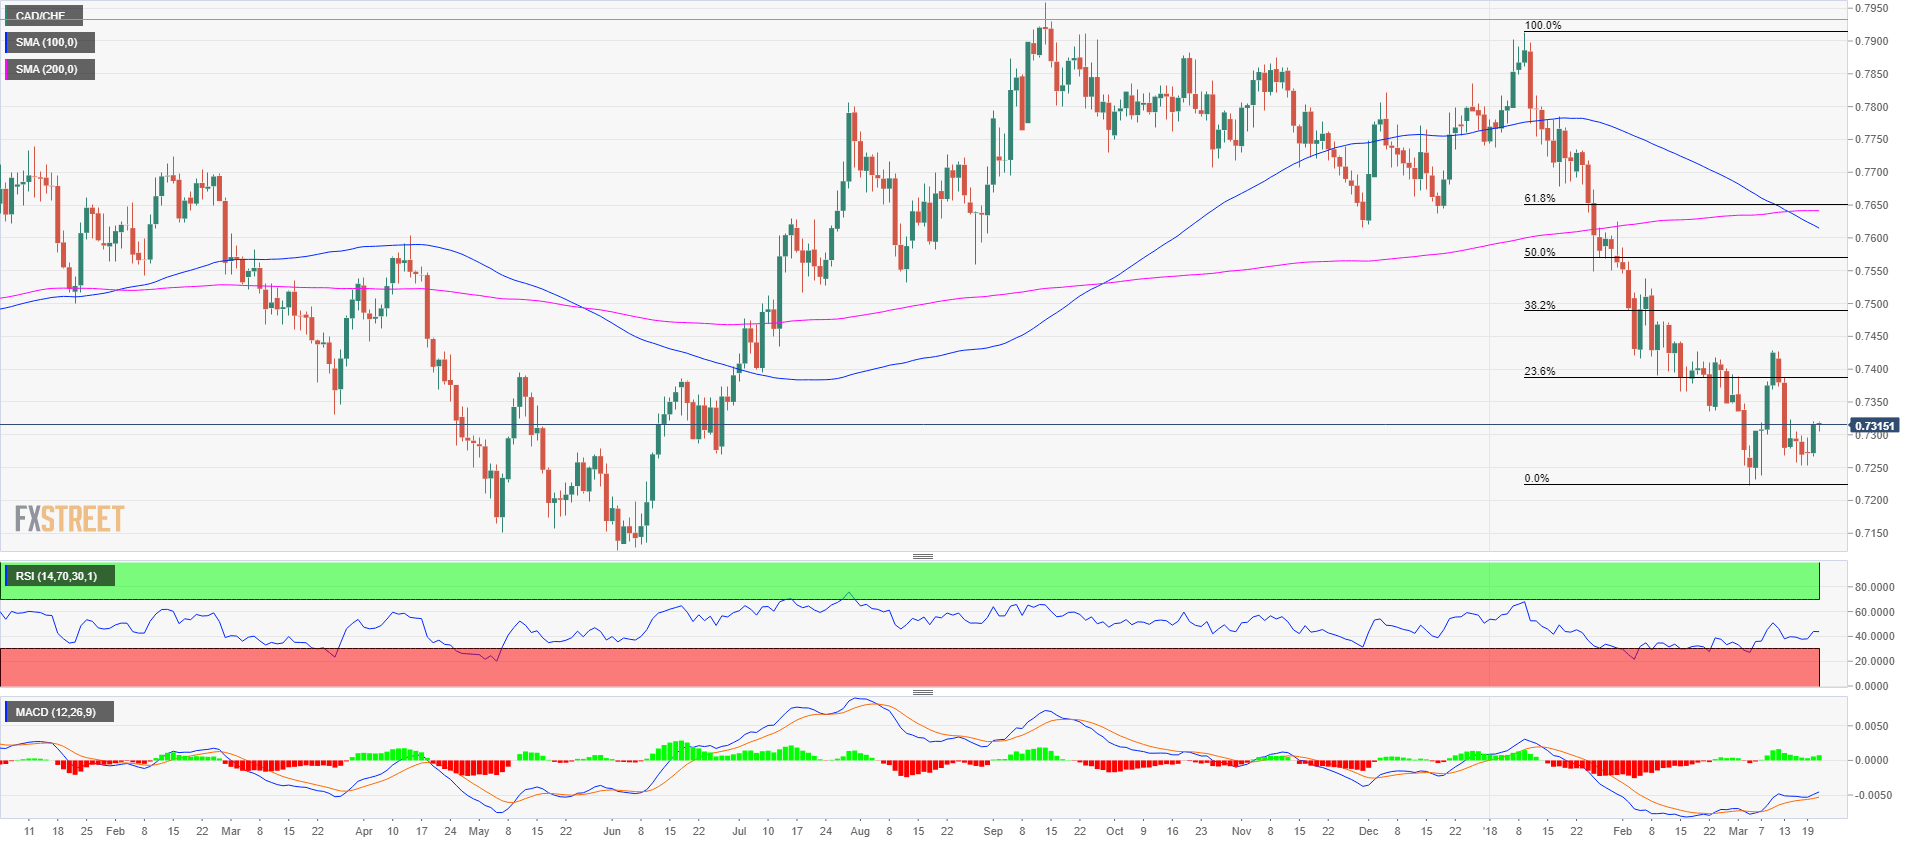
The daily picture offers a drastically different view with the both the RSI and MACD showing positive divergence as the CAD/CHF is consolidating. Support is seen at 0.7250, which is the low of last week, followed by 0.7220 cyclical low. Resistance is seen initially at the 0.7350figure, followed by the 0.7380-0.7400 region with the 23.8% Fibonacci retracement level from the January-March down move.
CAD/CHF 1-hour chart
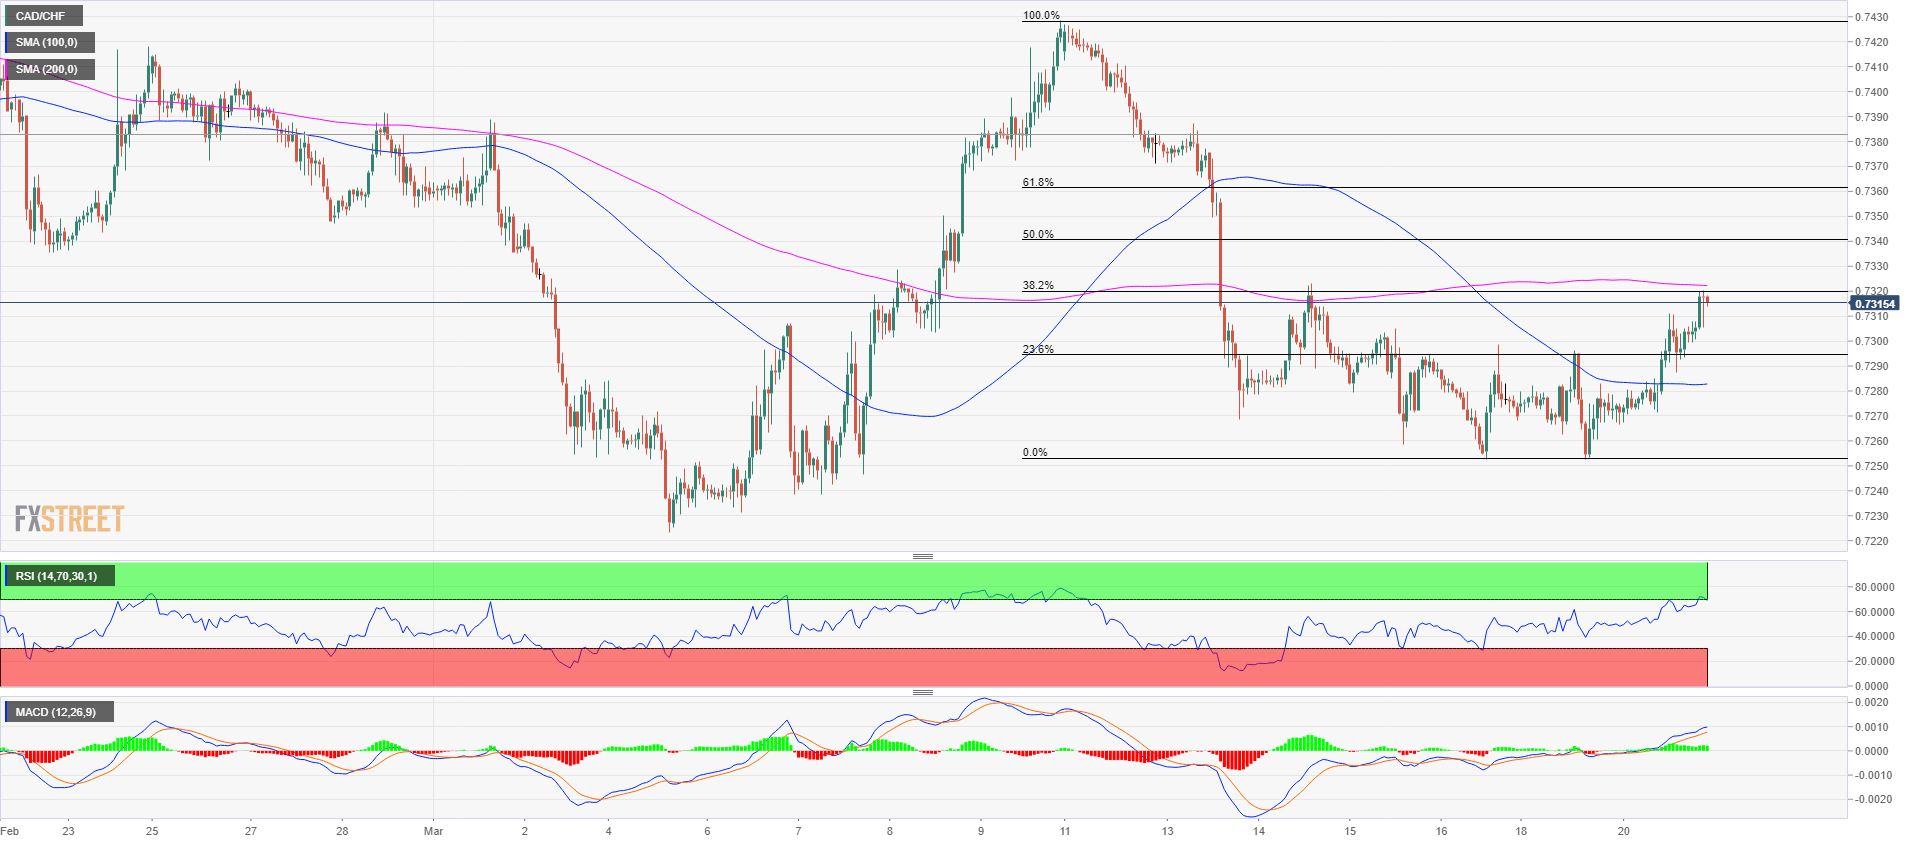
Equally interesting is the 1-hour chart which is pointing out the RSI and MACD positive divergence. If the 0.7320 is broken by the bulls, then next resistance is seen at 0.7340 50% Fibonacci retracement from the March 9-16 bear move; followed by the 0.7360 level at the 61.8% Fibonacci retracement level. To the flip side, if the bulls fail, near-term support is seen at 0.7294 with the 23.6% Fibonacci retracement level; followed by the 0.7250 last swing low.
Note: All information on this page is subject to change. The use of this website constitutes acceptance of our user agreement. Please read our privacy policy and legal disclaimer. Opinions expressed at FXstreet.com are those of the individual authors and do not necessarily represent the opinion of FXstreet.com or its management. Risk Disclosure: Trading foreign exchange on margin carries a high level of risk, and may not be suitable for all investors. The high degree of leverage can work against you as well as for you. Before deciding to invest in foreign exchange you should carefully consider your investment objectives, level of experience, and risk appetite. The possibility exists that you could sustain a loss of some or all of your initial investment and therefore you should not invest money that you cannot afford to lose. You should be aware of all the risks associated with foreign exchange trading, and seek advice from an independent financial advisor if you have any doubts.
Recommended content
Editors’ Picks
AUD/USD remains under pressure above 0.6400

AUD/USD managed to regain some composure and rebounded markedly from Tuesday’s YTD lows in the sub-0.6400 region ahead of the release of the Australian labour market report on Thursday.
EUR/USD faces decent contention around 1.0600

The knee-jerk in the Greenback reignited some buying interest in the risk complex and pushed EUR/USD to three-day highs near 1.0680, rapidly leaving behind the recent yearly low around 1.0600.
Gold eases despite risk-off mood

Gold trades in a relatively tight range near $2,390 in the second half of the day on Wednesday. In the absence of high-tier data releases, investors keep a close eye on headlines surrounding the Iran-Israel conflict.
Ethereum trades around the $3,000 support following a surge in validator queue

Ethereum (ETH) continued a sideways movement on Wednesday as investors seemed to be waiting for an upward or downward price catalyst. Despite the price stagnancy, the ETH validator queue - possibly fueled by the DeFi restaking boom - rose sharply.
Markets stabilize after Powell rules out rate hike, but the signs don’t look good

Markets are volatile right now; however, a relative calm has descended on the market and US. US stocks are down a touch, but the Vix is lower, US Treasury yields are lower, and the dollar is mostly lower vs. its G10 FX counterparts.