


Talking Points:
- The US Dollar has continued to gain, continuing last week’s move of strength to tally a 2% move off of last Tuesday’s lows. DXY is now testing a key area of resistance around the 2017 swing-low, and the potential exists for a deeper move of USD-strength as we approach rate decisions out of Europe and Japan.
- The big question around the US Dollar is whether a short-term spate of strength might be able to turn into anything more. The down-trend in the Dollar is now more than a year-old, and there’s a case to be made for a short-squeeze scenario after the Greenback spent most of Q1 dwindling around three-year lows.
- DailyFX Forecasts have been updated for Q2, and are available from the DailyFX Trading Guides page. If you’re looking to improve your trading approach, check out Traits of Successful Traders. And if you’re looking for an introductory primer to the Forex market, check out our New to FX Guide.
Do you want to see how retail traders are currently trading the US Dollar? Check out our IG Client Sentiment Indicator.
US Dollar Rallies to Fresh Three-Month Highs
US Dollar strength has continued, and the Greenback is now up by 2% from last Tuesday’s low. Considering that this is a non-levered currency, that’s a respectable move in a short period of time, and the US Dollar currently finds itself in a key zone of resistance that we looked at yesterday. This resistance zone is taken from a batch of swing-highs in early-March up to the 2017 swing-low at 91.01. DXY moved into this zone yesterday afternoon, and prices have been ranging back-and-forth ever since.
US Dollar Rallies into Key Resistance Zone
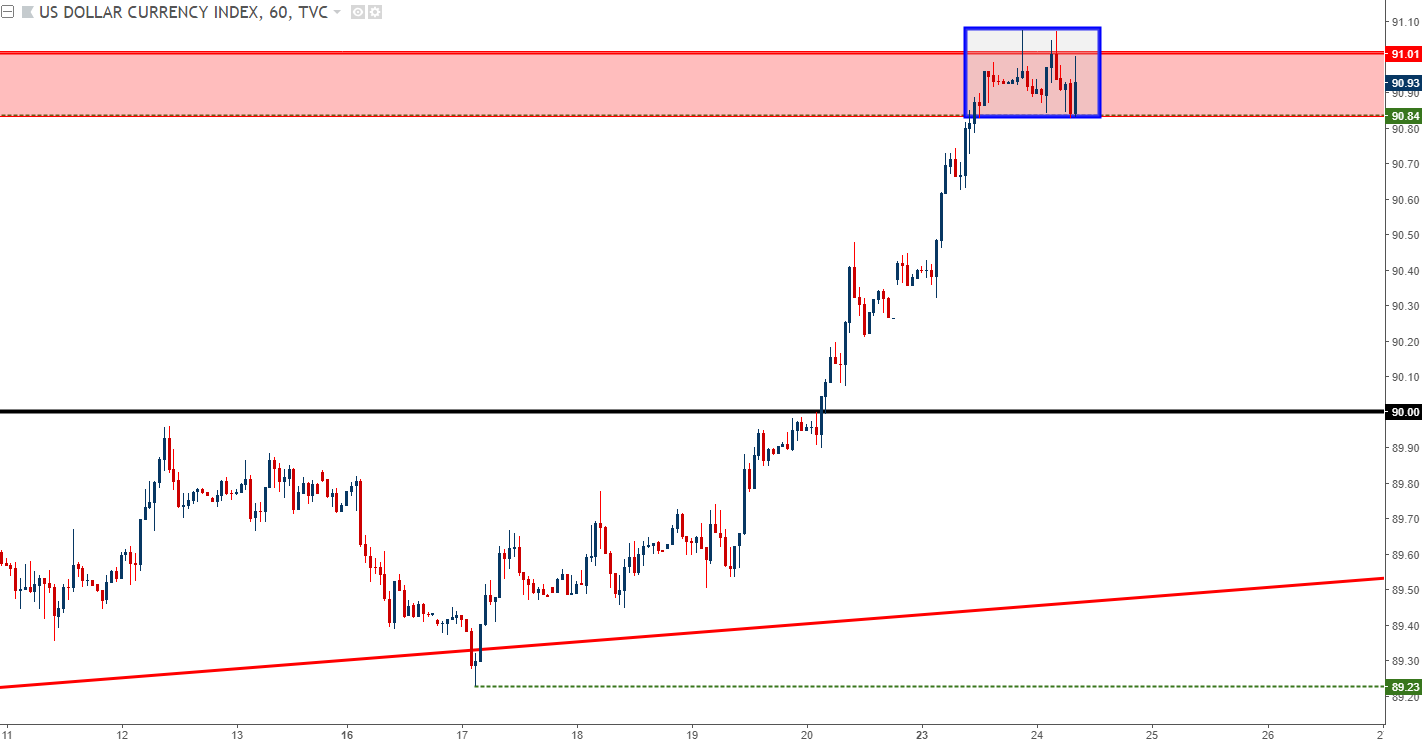
Chart prepared by James Stanley
Putting this move in scope, the US Dollar has set a technical three-month high. I say technical because prices didn’t stay there for long, and quickly pulled back below the 91.01 level that was the 2017 swing-low.
US Dollar via ‘DXY’ Four-Hour Chart: In Key Resistance Zone From 2017 Swing-Low

Chart prepared by James Stanley
Can US Dollar Bulls Stage a Deeper Move of Dollar Strength?
The big question here appears to be linked to two rate decisions on the schedule for later this week. On Thursday, we hear from the ECB and later that night/the following morning, we hear from the Bank of Japan.
Each of these Central Banks remain at ‘pedal to the floor’ levels of monetary accommodation. Neither has shown a desire or even a willingness for that to change. As the fundamental backdrop improved in Europe last year, we saw market participants buying the single currency in anticipation of this happening but, to date, it hasn’t. Many were expecting to get a bit of clarity this week, as the ECB’s current QE program is set to wrap up in September. But given the fact that the fundamental backdrop has seen data slow, with inflation softening, and there isn’t that same level of motivation; it now looks like we’ll have to wait until July to find out what the ECB plans to do with QE.
In Japan, the story is a bit more recent but similar in nature. Inflation started to pick up in December, and then ran up to 1.4% in January, which was a fresh 34-month high. When February inflation came-in at 1.5%, there was a legitimate fear that what happened to the Euro last year might happen to the Yen this year; and that’s considerable buying by market participants trying to get in-front of what starts to feel like an inevitable stimulus exit.
Last week saw Japanese inflation numbers soften back to 1.1%, and this helps the Yen take a step back from the ledge of risk aversion, much as we saw in Q1. So, the backdrop is there for a deeper move of near-term US Dollar strength. The bigger question is what each of these banks might say and for how long any prevailing weakness might run in either the Euro or the Yen.
Japanese Inflation Since January, 2017: March Softening Removes Pressure from Yen-Strength

USD/JPY Breaks Out
USD/JPY is wasting no time. We looked at bullish breakout as one of the FX setups for this week, and in short-order prices ran up to fresh two-month highs after the Sunday open. That topside move has largely continued, and at this stage we’re seeing a bit of resistance set-in about 100 pips above that prior point of interest. Bulls haven’t yet shown signs of giving up, but given the potential for volatility later in the week, and traders will likely want to wait for prices to pull back before taking on additional long exposure.
On the hourly chart below, we can see where bullish momentum is beginning to wane as indicated by the elongated wicks on either side of the candles that have printed for the past 18 hours. While bulls haven’t yet pulled bids to allow the pair to pose a deeper pullback, the shakiness showing in price action up here may be preluding a pullback after a really aggressive topside run.
RSI divergence has been showing rather clearly on the hourly chart, and this urges caution against chasing the pair after the earlier-week breakout. This also highlights the area from 108.10-108.28 as potential higher-low support.
USD/JPY Hourly Chart: Higher-Low Support Potential After Bullish Breakout

Chart prepared by James Stanley
EUR/USD Falls to Seven-Week Low
We looked at a confluent area of support in EUR/USD yesterday, as prices had moved down to a bullish trend-line that met up with the swing-lows from earlier in April. This zone could not hold, and at this point, we’ve seen a couple of different iterations of sellers coming in to offer resistance around that prior April swing-low. This highlights bearish continuation potential, although there are a couple of support levels a bit-deeper that may regulate the move.
At 1.2167 we have the 50% retracement of the 2014-2017 major move, and a bit below that at 1.2070-1.2090 we have a prior swing-high from early-January. If this can’t hold, then the 1.2000 psychological level is exposed, and noteworthy is how this level had given some very rigid resistance in 2017 but, as of yet, hasn’t shown much for support.
EUR/USD Four-Hour Chart: Deeper Support Potential After Print of Seven-Week Lows
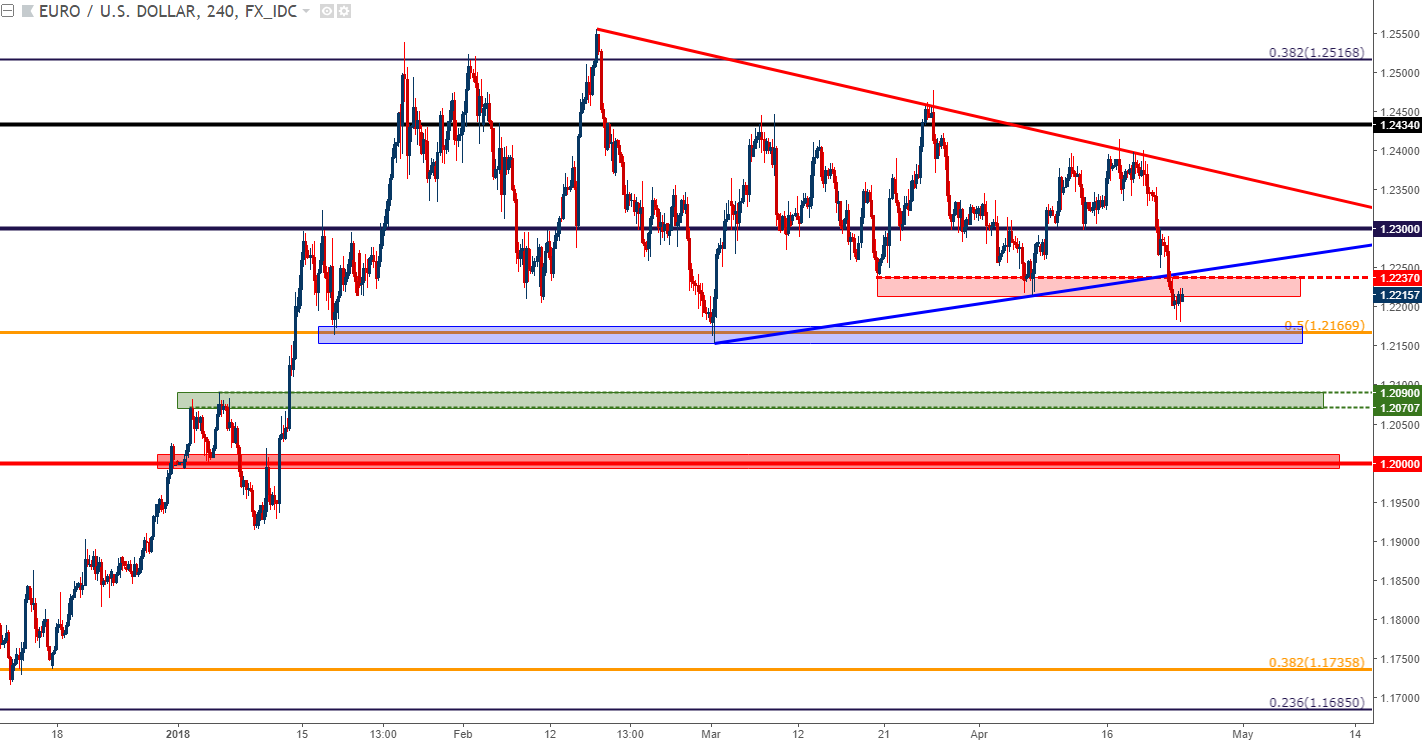
Chart prepared by James Stanley
GBP/USD: Resistance Potential at Prior Support
The 1.4000 level has been a big level on the chart of GBP/USD so far in 2018. We broke above in the first few weeks of the year, and since then there have been multiple support/resistance inflections around this zone as the pair has tried to find a direction. This area had previously helped us to find support earlier in April, as GBP/USD was carving out a short-term bottom around Non-Farm Payrolls.
And that bullish theme spent the next couple of weeks running up to fresh post-Brexit highs, but when last week’s UK inflation printed in a rather disappointing manner, much of that enthusiasm was soon missing from the market. Prices have scaled back-down on the chart even faster than they’d originally run-up; and at this point, we have the potential for that prior area of interest for support to be re-used as lower-high resistance.
GBP/USD Four-Hour Chart: Resistance Potential at Prior Support Zone Around 1.4000

Chart prepared by James Stanley
Commodity Currencies for USD-Strength
We looked at the short-side of NZD/USD last Wednesday to work with USD-strength, and the pair is now in the process of making fresh three-month lows. The backdrop for the setup was a range that’s been alive since the summer of 2016, and after spending a couple of months in the resistance side of that range, prices have started to fall-in towards support. The support side of this range is between .6820-.6875, so if this is to continue, there is some additional room to work with bearish positions, targeting towards the .7000 psychological level ahead of a test of that longer-term support.
NZD/USD Weekly Chart: Multi-Month Range Filling-In on USD-Strength

Chart prepared by James Stanley
To read more:
Are you looking for longer-term analysis on the U.S. Dollar? Our DailyFX Forecasts for Q1 have a section for each major currency, and we also offer a plethora of resources on USD-pairs such as EUR/USD, GBP/USD, USD/JPY, AUD/USD. Traders can also stay up with near-term positioning via our IG Client Sentiment Indicator.
Forex Trading Resources
DailyFX offers a plethora of tools, indicators and resources to help traders. For those looking for trading ideas, our IG Client Sentiment shows the positioning of retail traders with actual live trades and positions. Our trading guides bring our DailyFX Quarterly Forecasts and our Top Trading Opportunities; and our real-time news feed has intra-day interactions from the DailyFX team. And if you’re looking for real-time analysis, our DailyFX Webinars offer numerous sessions each week in which you can see how and why we’re looking at what we’re looking at.
If you’re looking for educational information, our New to FX guide is there to help new(er) traders while our Traits of Successful Traders research is built to help sharpen the skill set by focusing on risk and trade management.
--- Written by James Stanley, Strategist for DailyFX.com
To receive James Stanley’s analysis directly via email, please SIGN UP HERE
Contact and follow James on Twitter: @JStanleyFX


