


Ichimoku Technical Analysis Focus:
- US Dollar Index breaks above Ichimoku cloud for the first time in 2018
- Haven currencies continue to weaken as JPY drops below 100-DMA vs. USD
- Commodity FX falls fast against US Dollar
Boom goes the US Dollar. Given the previously sanguine FX volatility levels, that’s exactly what the current move higher in the US Dollar is seeming. The New Zealand Dollar has fallen by over 3% since mid-April, and a favored pair of the market, USD/JPY looks to be looking 110, and multiple other pairs have lost 2% against the US Dollar.
Now that the US Dollar is riding a yield-fueled surge to three-month highs, the question becomes as to whether this is a rehash of 2014 when the US Dollar when came out of nowhere to break higher and send the world into a dollar shortage as the Fed kicked off their current interest rate hiking cycle.
One key way of looking behind FX markets to get an idea of what trends you should be watching is the aggregate volatility index from Deutsche Bank, which may be putting in a double-bottom near the early January low.
Want a full (& FREE) guide to walk you through Ichimoku? I created one here
Deutsche Bank Currency Volatility Index May Have Set A Higher Low
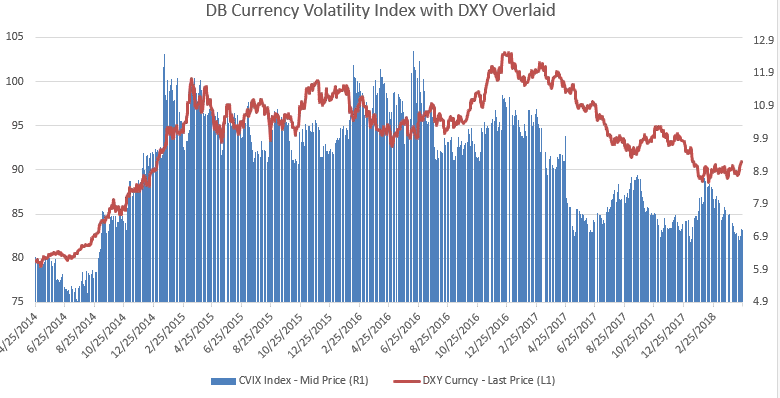
Data source: Deutsche Bank, Bloomberg
I share with you the broader volatility picture to help you see that if volatility is about to move higher in FX, which seems likely given the multi-year extremes against the US Dollar as the US Dollar may retire as the sick man of the market then big moves may be on the horizon.
The overlay of the US Dollar on the DB Volatility Index is worth showing because if volatility is here, it will be hard to break the correlation of a stronger US Dollar. One common theme over the years is the instability can lead to stability and stability can lead to unstable markets. Despite the wild headlines of 2016, 2017 will be looked back on as an idyllic market as 2017 provided the narrowest range in UST 10-year yields since 1965. The question, which Ichimoku can help you answer is where your focus should be if the US Dollar does continue to strengthen alongside a rise in volatility?
The Ichimoku Charts that matter this week will focus on the following currencies:
- JPY & Swissy weakness that aligns with the bid in commodities and sell off in bonds.
- AUD weakness resumes breaking the 2-year trend line
- EUR breakdown in focus as ECB may help kickoff DXY momentum breakout
Dollar Takes the Driver’s Seat As Havens Remain Defensive
One of the first places that traders discovered higher-lows and higher-highs was against haven currencies like the Swiss Franc and Japanese Yen. On Tuesday, the Japanese Yen fell below the 100-DMA against the US Dollar thanks in large part to the move higher in the 10-year US Treasury yield rising above 3% for the first time since January 2014.
USD/JPY Is Joining UST 10Y Yield's March Higher
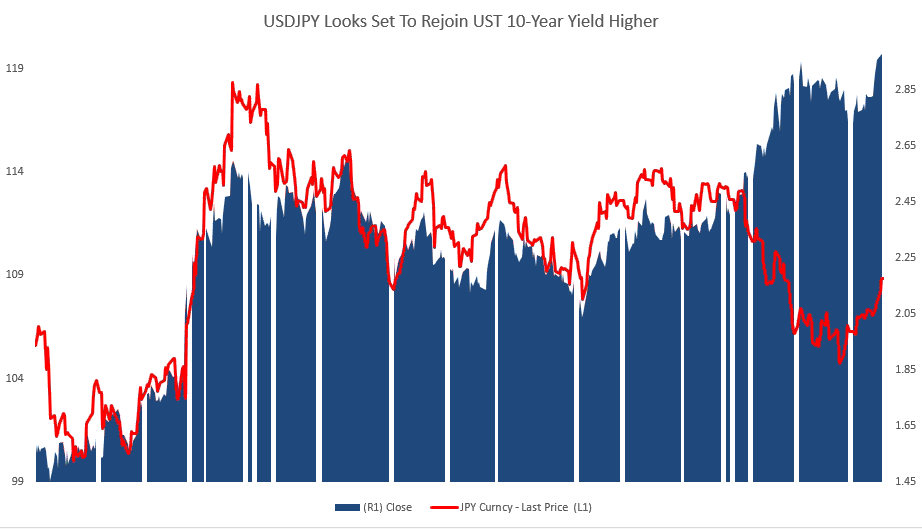
Data source: Bloomberg
Applying Ichimoku with a clearer understanding of the backdrop of rising yields and potentially rising volatility can help you keep a sharper eye on the US Dollar Index. Since January 2017, the US Dollar Index has traded below the daily Ichimoku cloud with only a brief respite in October and early November with the price and lagging line above the cloud. That move was ultimately revealed to be corrective. However, a move above the cloud that is sustained with the lagging line following suit would likely align with a sharp unwind that would likely hurt many of the remaining US Dollar bears.
US Dollar Index Pushes Resistance On Recent Breakout
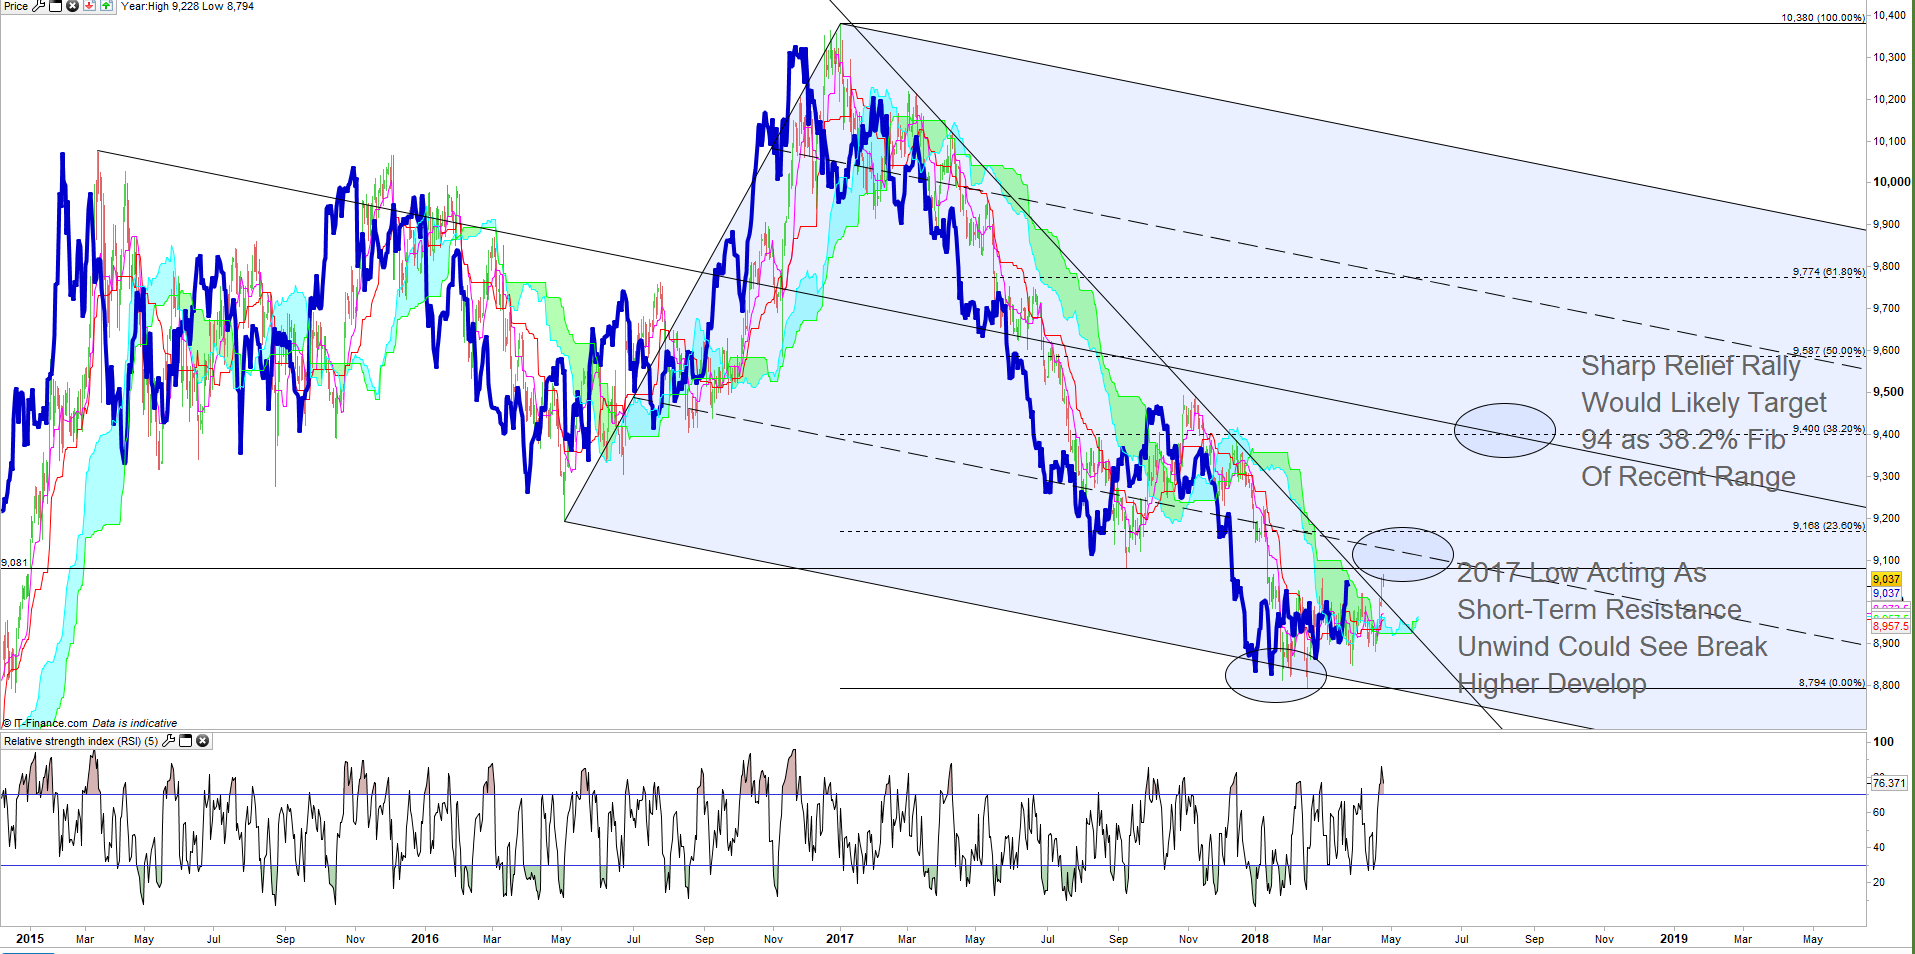
Chart Source: Pro Real Time, an IG Charting Package, IG UK Price Feed. Created by Tyler Yell, CMT
The blue line is a visualization of momentum relative to chart resistance like the Ichimoku cloud. If the daily blue line breaks higher, the fundamental backdrop would say it is likely due to a rise in commodities and yields that could also be supporting currency volatility. Either way, such an environment without negative shocks (those would come later if inflation inflates away profits) would make selling CHF and JPY the favored play against the US Dollar.
USDJPY Chart Shows Breakout With Pullbacks As Opportunity
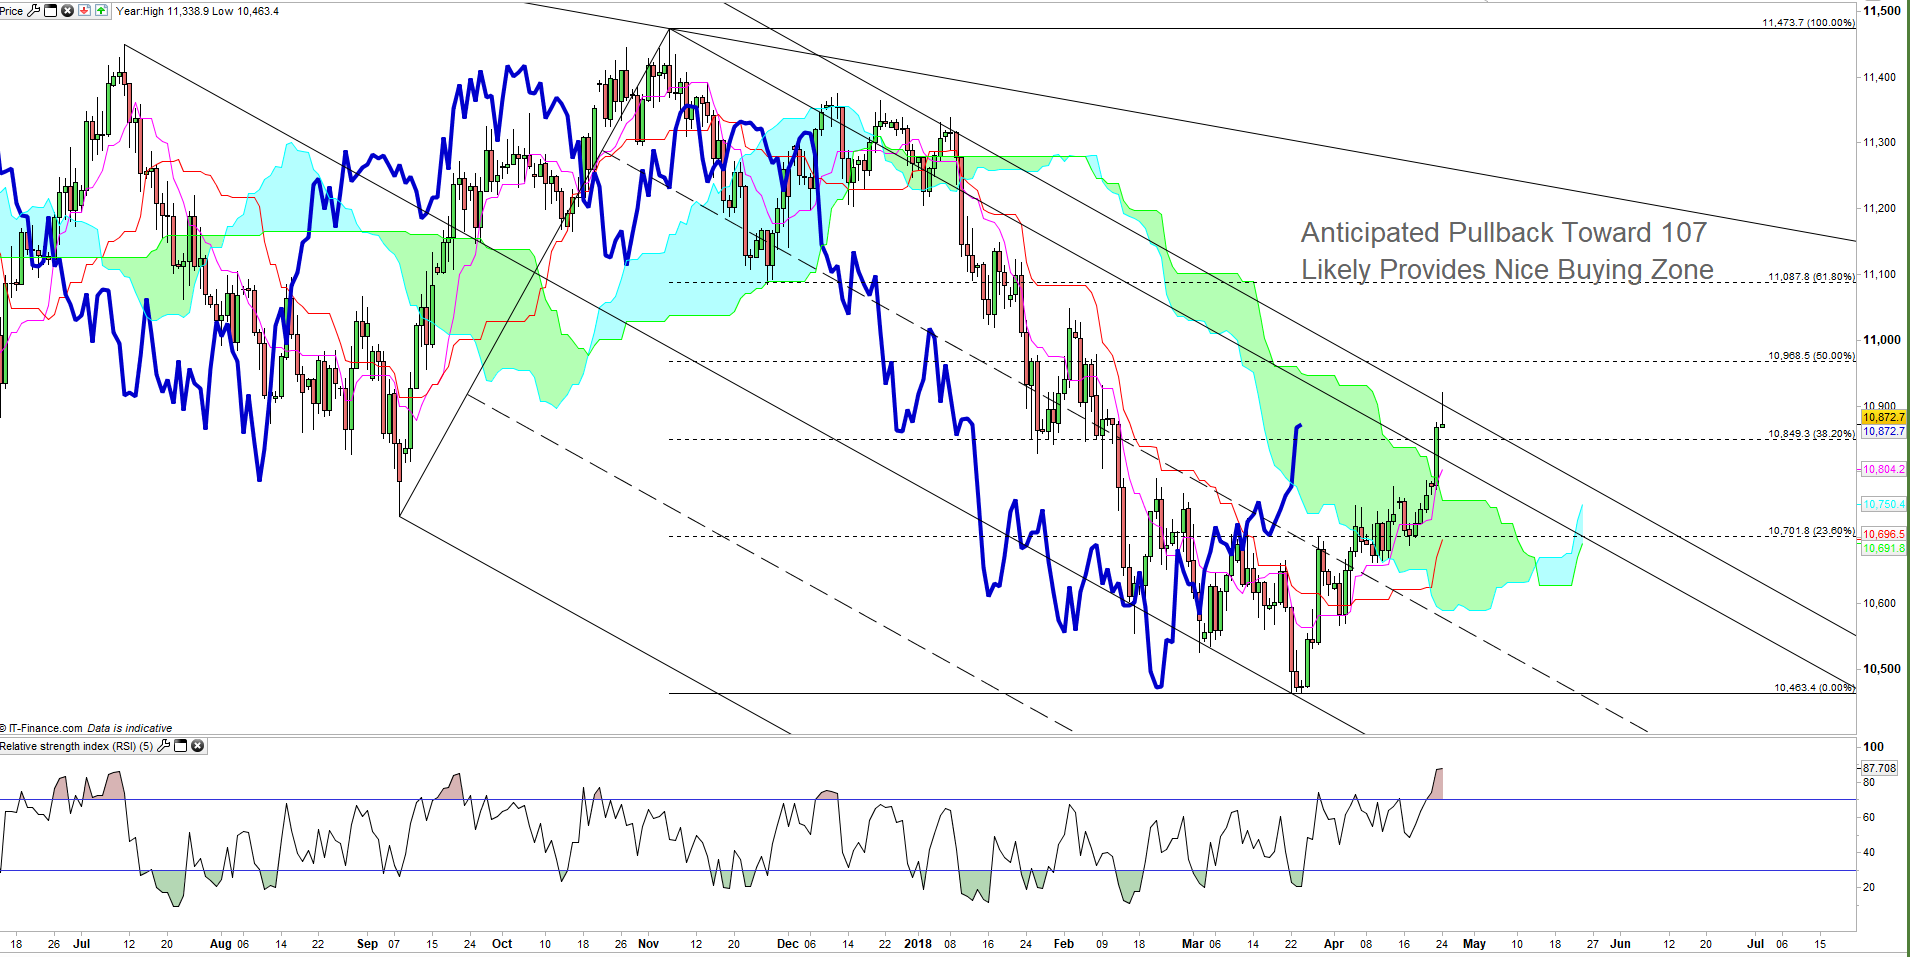
Chart Source: Pro Real Time, an IG Charting Package, IG UK Price Feed. Created by Tyler Yell, CMT
In one-month, USD/JPY has rallied by over 4%, and it may be time for a short-term pullback before the next leg higher. Markets tend not to move in a straight line, but pull-backs with favorable fundamentals can give traders an opportunity to enter with a better risk: reward profile.
The support point on USD/JPY looks to be 107 range, which is a polarity point since March and is aligning with Bullish Ichimoku support.
Here’s our recent technical breakdown on JPY: USD/JPY Rate Forecast: Looking Free to Rally as Pair Tests Ichimoku
AUD Weakness Resumes to Break 2-Year Trend Line
No currency has been safe against the US Dollar, and the Australian Dollar has been a currency catching most of the negative market narratives out there. Whether AU household debt load is keeping the RBA patience, the potential trade wars hurting commodity demand, or the wrong commodities (regarding the AU terms of trade) rallying, the Australian Dollar has been falling alongside global equities.
AUD/USD Also Led Markets On DXY Strength With Ichimoku As Resistance
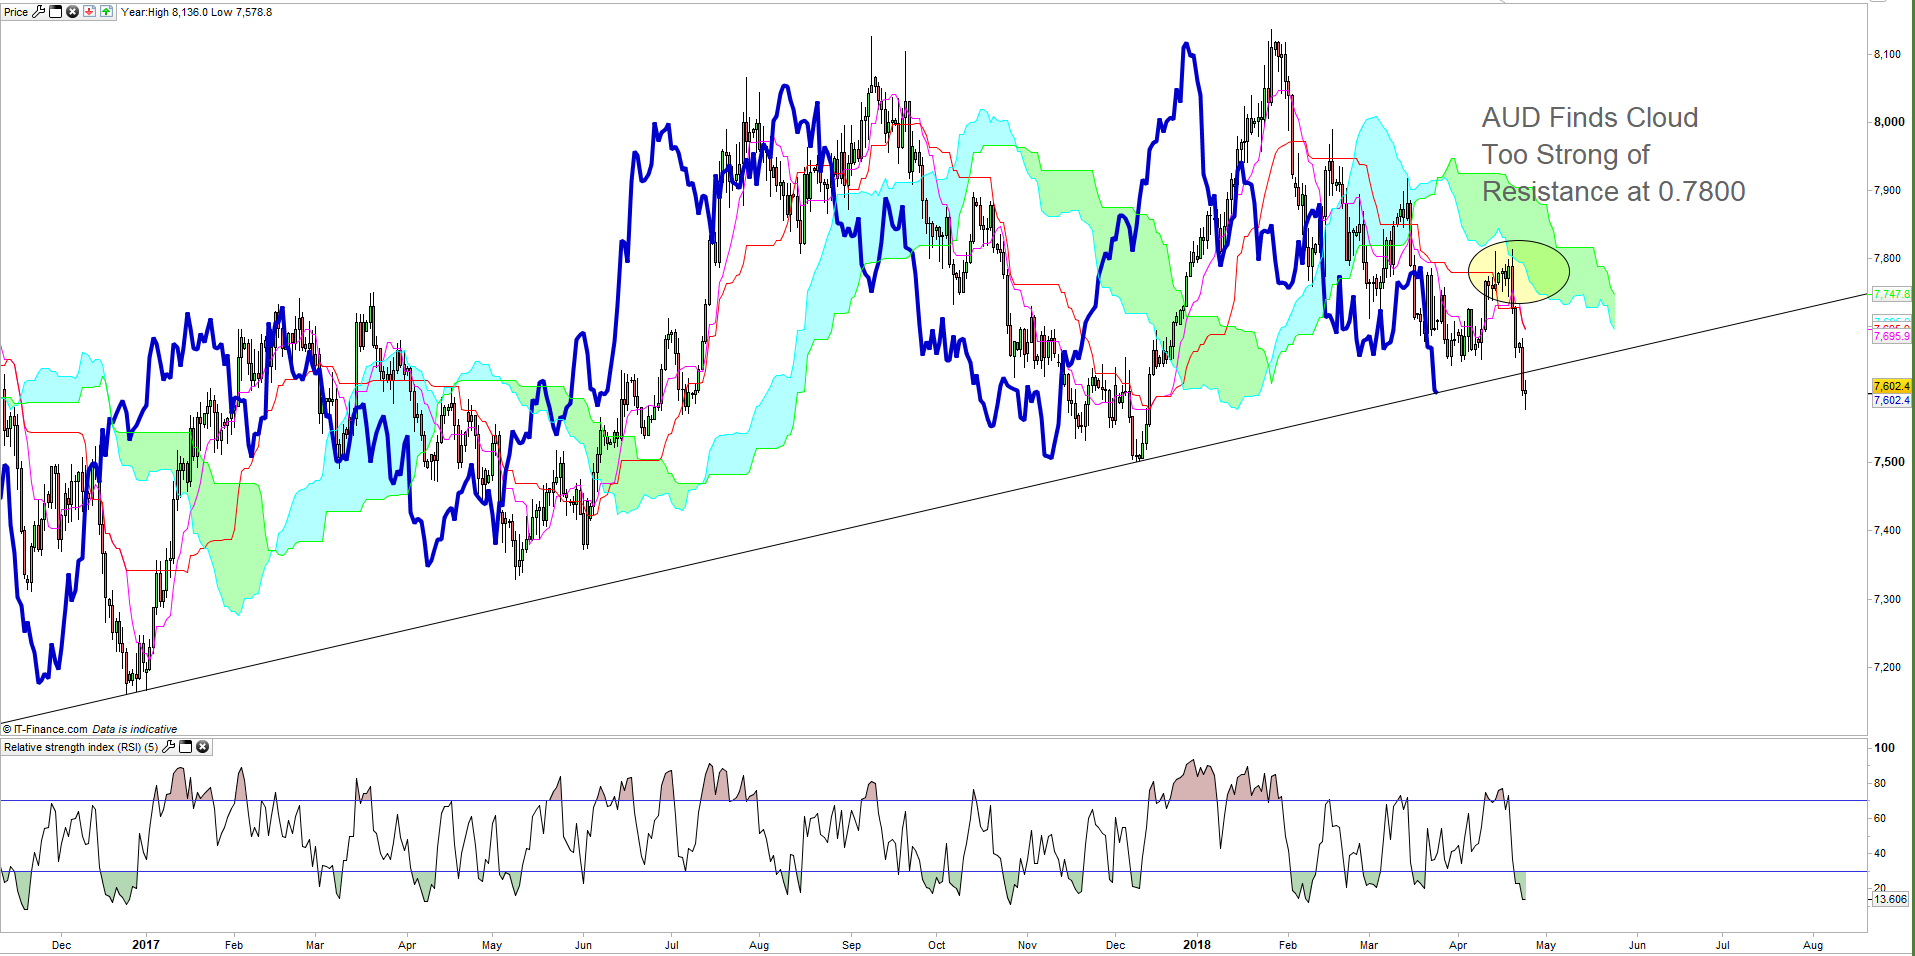
Chart Source: Pro Real Time, an IG Charting Package, IG UK Price Feed. Created by Tyler Yell, CMT
This week, markets saw slightly weaker CPI that continues to beat the drum of probable RBA patience. The negative news flow has left AUD vulnerable. However, a supporting point that should keep traders from getting too excited is that institutions have been bearish on AUD over the last six weeks per the CFTC CoT report. This means the unwind that could develop on GBP/USD, USD/JPY, and EUR/USD would probably be much more aggressive than on AUD/USD.
The lack of unwinding doesn’t mean that the AUD/USD short trade can’t work. Rather, the move has already started, which shouldn’t be too much of a surprise given we just hit a 2018 low.
EUR/USD Sitting On Ichimoku Support Ahead of ECB
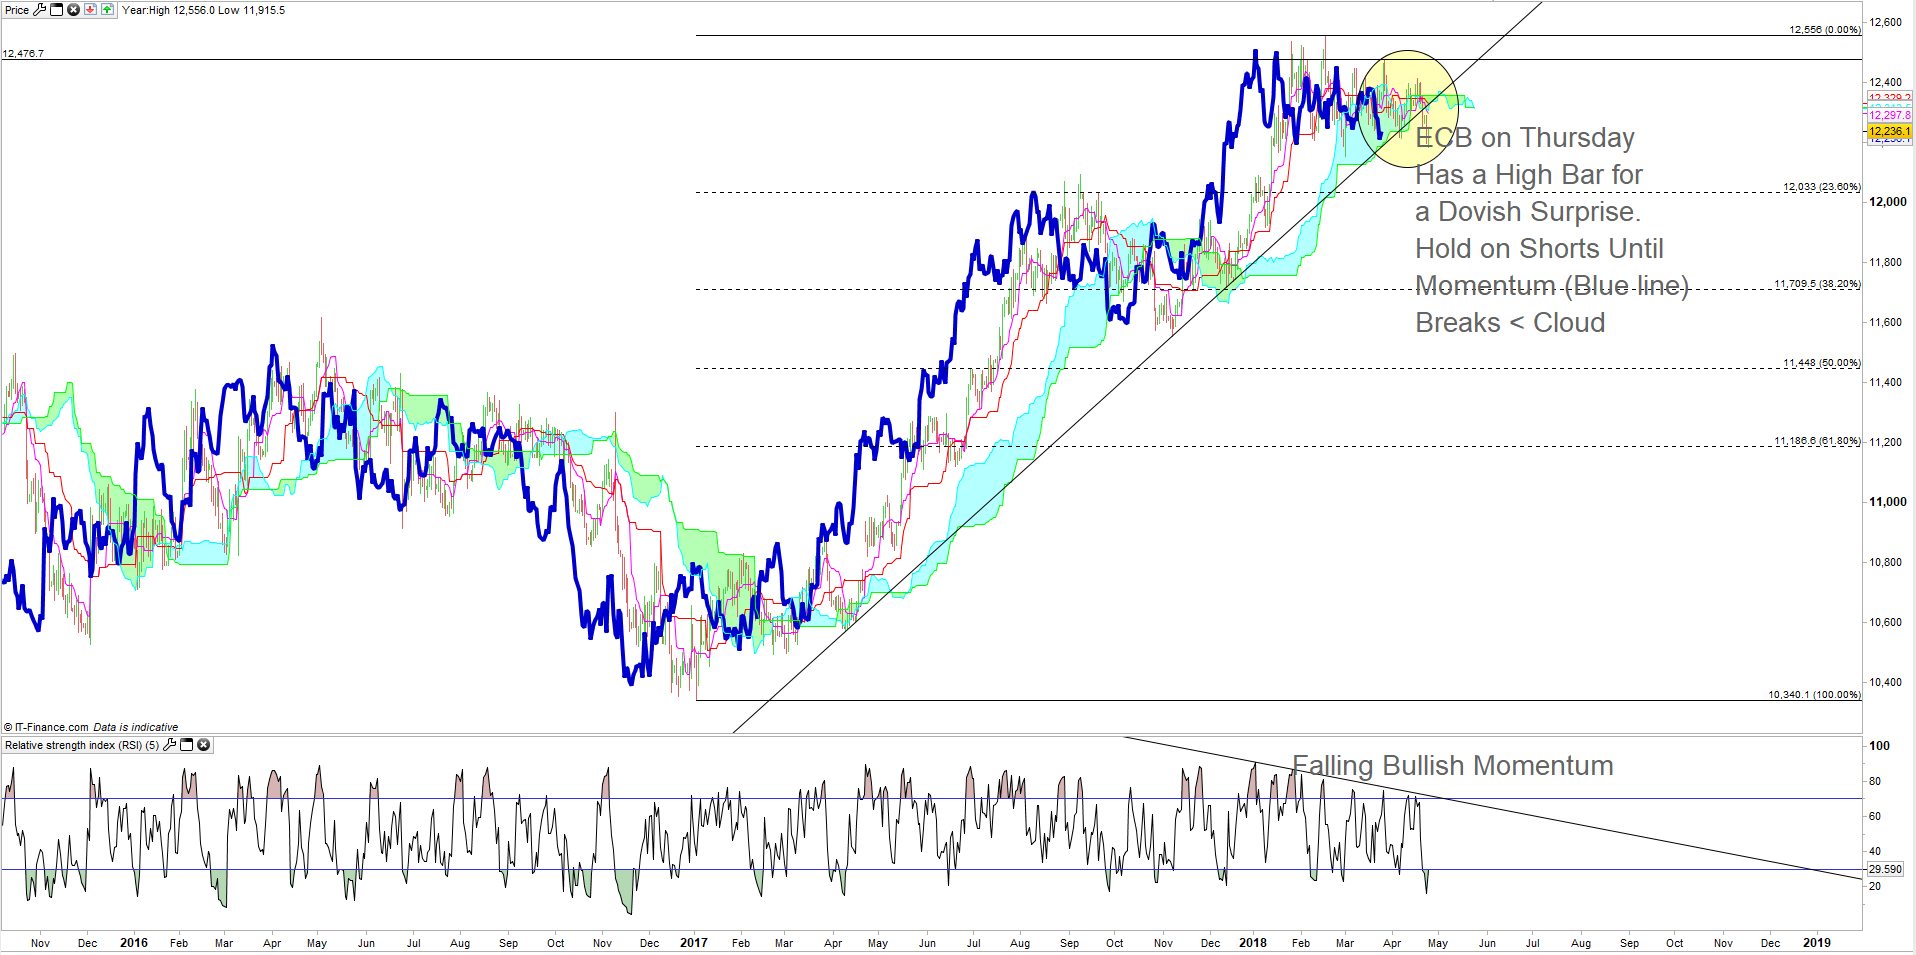
Chart Source: Pro Real Time, an IG Charting Package, IG UK Price Feed. Created by Tyler Yell, CMT
EUR/USD has moved sideways for a majority of 2018 that makes the argument that a larger move is upon us. Given the stretched positioning, traders should watch how the charts react to the ECB meeting on Thursday.
A strong dovish message, though the bar is high for a dovish surprise could shift EUR/USD to a bearish regime. Across the G10, EUR/USD looks to be the most stubborn to leave the prior move higher (US Dollar lower.) A breakdown where the lagging line (blue line) moves below the cloud would open up a move to 1.1710 (38.2% of 2017-Feb. 2018 range) with a possible move to the 50% retracement of the same range at 1.1450.
Not familiar with Fibonacci analysis, check out this insightful article
Adding to Ichimoku with IG Client Sentiment
Ichimoku has value in helping traders see and trade in the direction of a momentum-backed trend. Retail traders, at least when looked through the lens of IG Client Sentiment, tend to fight strong trends.
We often recommend backing your technical analysis with IG client sentiment as it can do a good job of helping you see sentiment backed moves, which tend to carry on for long periods, which can make for good trades if you’re on the right side.
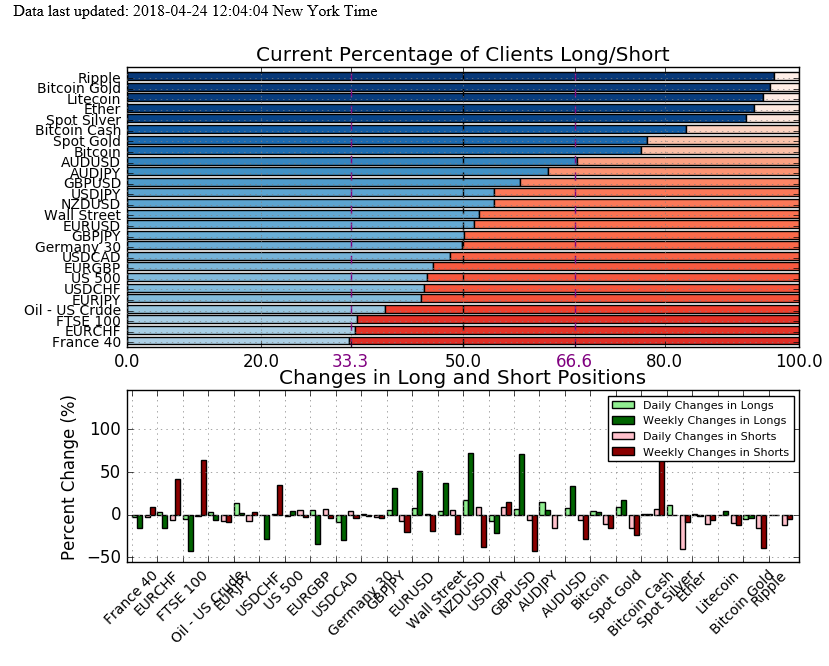
Source: IG CLIENT SENTIMENT data provided by IG
For those needing a refresher, Dailyfx will typically take a contrarian view to crowd sentiment, and when retail traders are building a net-short position, the signal is often triggered to buy or at least suggests prices may rise.
Recently, there has been a jump in retail short positions against the US Dollar as seen on NZD/NZD, GBP/USD, EUR/USD, and USD/JPY that would favor further USD appreciation that is in-line with Ichimoku analysis.
New to FX trading? No worries, we created this guide just for you.
---Written by Tyler Yell, CMT
Tyler Yell is a Chartered Market Technician. Tyler provides Technical analysis that is powered by fundamental factors on key markets as well as t1rading educational resources. Read more of Tyler’s Technical reports via his bio page.
Communicate with Tyler and have your shout below by posting in the comments area. Feel free to include your market views as well.
Discuss this market with Tyler in the live webinar, FX Closing Bell, Weekdays Monday-Thursday at 3 pm ET.
Talk markets on twitter @ForexYell
Join Tyler’s distribution list.


