
Advertisement
Advertisement
Natural Gas Rebounds on Hot Weather forecast
By:
Natural gas price rose more than 1.5% on Tuesday, as warmer than normal weather is expected to cover most of the United States for the next 8-14 days
Natural gas price rose more than 1.5% on Tuesday, as warmer than normal weather is expected to cover most of the United States for the next 8-14 days according to the National Oceanic Atmospheric Administration. Supply is down slightly but demand has been lower, keeping natural gas prices rangebound.
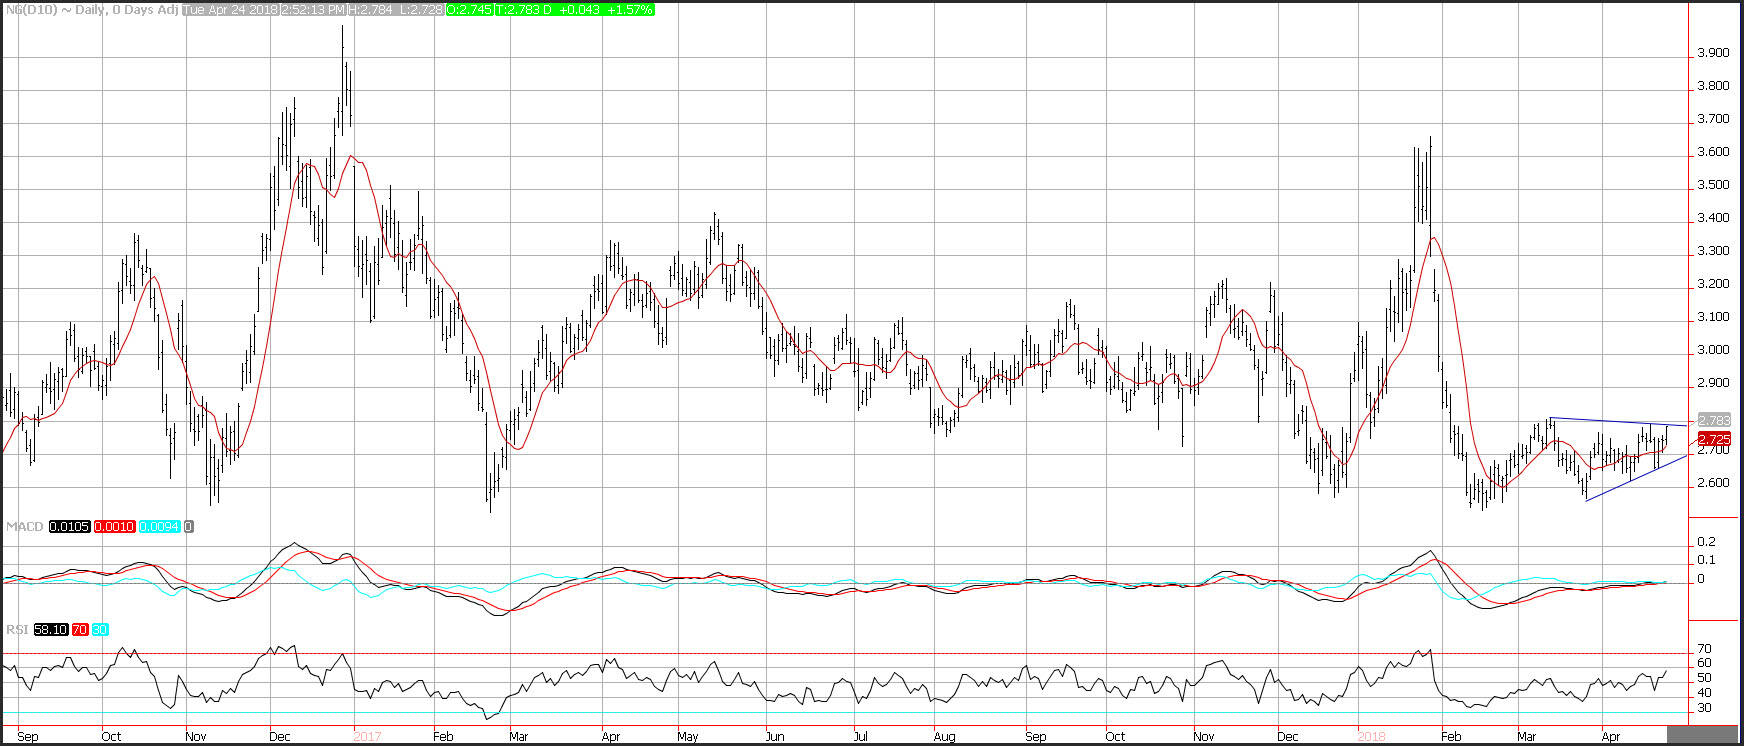
Prices rebounded to resistance near a downward sloping trend line at 2.78. Support is seen near the 10-day moving average at 2.72. Additional support is seen near an upward sloping trend line that comes in near 2.67. The relative strength index (RSI) moved higher breaking out reflecting accelerating positive momentum.
Supply falls slightly. According to data from the EIA, the average total supply of natural gas fell by 1% compared with the previous report week. Dry natural gas production decreased by 1% compared with the previous report week, and average net imports from Canada decreased by 9% from last week.
Demand falls
Total U.S. consumption of natural gas fell by 9% compared with the previous report week, according to data from the EIA. In the residential and commercial sectors, consumption declined by 22% as warm temperatures in the South and West offset increases in heating demand in the Midwest and Northeast. Natural gas consumed for power generation climbed by 2% week over week. Industrial sector consumption decreased by 3% week over week. Natural gas exports to Mexico decreased 1%.
U.S. LNG exports increase week over week. Six vessels combined LNG-carrying capacity 21.6 Bcf departed the Sabine Pass liquefaction facility from April 12 to April 18. One vessel LNG-carrying capacity 3.8 Bcf was loading at the terminal on Wednesday.
Colder-than-normal temperatures drive withdrawals in the Midwest, East, and South Central regions. Working gas stocks in the East, Midwest, and South Central regions posted net withdrawals on the week, in contrast to average net injections typically reported for the storage week in the month of April. Net withdrawals totaled 10 Bcf and 18 Bcf in the Midwest and East regions, respectively, compared with the five-year average net injections of 6 Bcf and 5 Bcf in these regions. In the South Central region, the weekly net draw totaled 12 Bcf compared with the five-year average weekly net build of 22 Bcf.
About the Author
David Beckerauthor
David Becker focuses his attention on various consulting and portfolio management activities at Fortuity LLC, where he currently provides oversight for a multimillion-dollar portfolio consisting of commodities, debt, equities, real estate, and more.
Did you find this article useful?
Latest news and analysis


Advertisement