
Advertisement
Advertisement
Natural Gas Breaks Out Following Larger than Expected Inventory Decline
By:
Natural gas prices broke out on Thursday following a larger than expected decline in natural gas inventories reported by the U.S. Department of Energy.
Natural gas prices broke out on Thursday following a larger than expected decline in natural gas inventories reported by the U.S. Department of Energy. The trajectory of working gas in storage is moving lower, at the beginning of the injections season. The weather is also expected to be warmer than normal throughout most of the west coasts, which will likely increase cooling demand Southern California. Colder than normal temperatures are forecast to cover most of the mid-west which should increase heating demand.
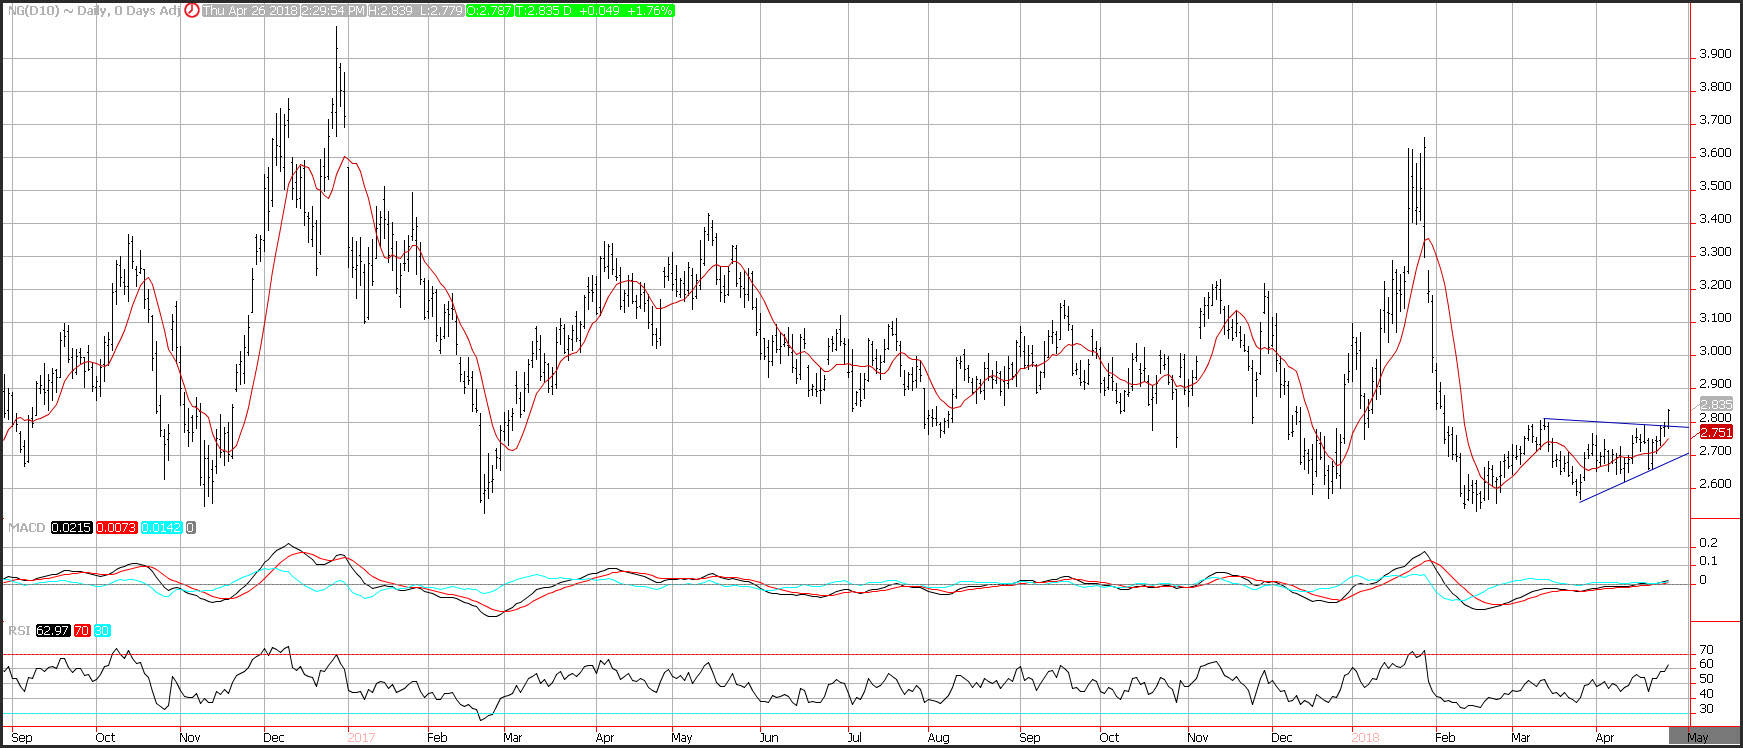
Technicals
Natural gas prices broke out from a relatively tight range surging higher by 1.75%, and making a fresh 2.5-month high. Prices could easily surge back to resistance near the 3.2 level. Momentum has turned positive as the MACD (moving average convergence divergence) index generated a crossover buy signal. This occurs as the MACD line (the 12-day moving average minus the 26-day moving average) crosses above the MACD signal line (the 9-day moving average of the MACD line). The MACD histogram is now printing in the black with an upward sloping trajectory which points to higher prices for natural gas. The RSI (relative strength index) surged higher breaking out which reflects accelerating positive momentum. The current reading on the RSI is 63, which is on the upper end of the neutral range but below the overbought trigger level of 70.
The EIA Reported a Larger than Expected Decline in Inventories
The Energy Information Administration reported that working gas in storage was 1,281 Bcf as of Friday, April 20, 2018. This represents a net decrease of 18 Bcf from the previous week. This compares to expectations that inventories would decline by 11 Bcf. Stocks were 897 Bcf less than last year at this time and 527 Bcf below the five-year average of 1,808 Bcf. Prices average 3.17 during the same month last year. At 1,281 Bcf, total working gas is within the five-year historical range.
About the Author
David Beckerauthor
David Becker focuses his attention on various consulting and portfolio management activities at Fortuity LLC, where he currently provides oversight for a multimillion-dollar portfolio consisting of commodities, debt, equities, real estate, and more.
Did you find this article useful?
Latest news and analysis


Advertisement