
Advertisement
Advertisement
Bitcoin Gold (BTG): A More Favorable Technical Setup Over Bitcoin (BTC)
Updated: Mar 4, 2019, 13:22 UTC
Bitcoin Gold is definitely priced to better take advantage of the upcoming breakout, whichever direction it may be.

Before we delve into the technical analysis of Bitcoin Gold (BTG) we’ll first give a brief background on it.
First of all, to illuminate any potential confusion for traders/investors that are new to the cryptocurrency market, Bitcoin Gold has absolutely nothing to do with gold, the precious metal. It is not backed by gold, it does not represent a measure of gold, and it is certainly not “made of gold.”
The term “gold” in Bitcoin Gold is there in name only. Bitcoin Gold is nothing more than a variant (referred to as a hard fork) of Bitcoin itself that allows for a different type of mining that is less cost prohibitive and results in more decentralization of the cryptocurrency.
As a consequence of being a Bitcoin hard fork, Bitcoin Gold’s price moves very much in tandem with Bitcoin itself. Below is the daily price charts of Bitcoin Gold (BTGUSD) and Bitcoin (BTCUSD). The similarity of price action for both cryptos jumps right of the charts.
CHART #1: Bitcoin Gold (BTGUSD) Daily
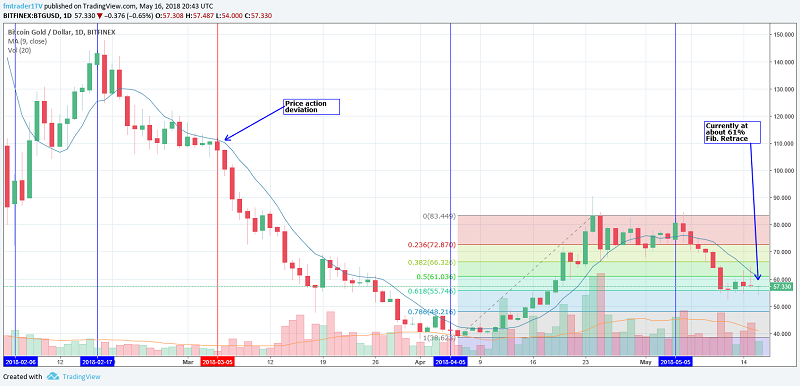
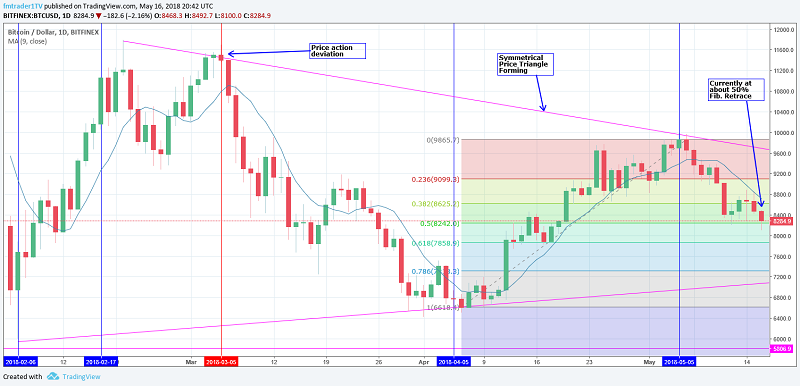
The blue vertical lines on both chart reference three similar dates when the price for both cryptos was at either a local low or a local high of a significant price swing. The red vertical lines indicate a period when the price for the two cryptos diverged. Also displayed on the daily charts is the current retracement that the two cryptos are in the midst of following the last local high for both cryptos on or about May 5, 2018.
Bitcoin has experienced a Fibonacci retraced to about 50%, while Bitcoin Gold is at about 61%. Close inspection of the charts show that the direction and duration of price movements are generally the same, but the relative price moves in percentage terms vary to a greater extent for bitcoin gold.
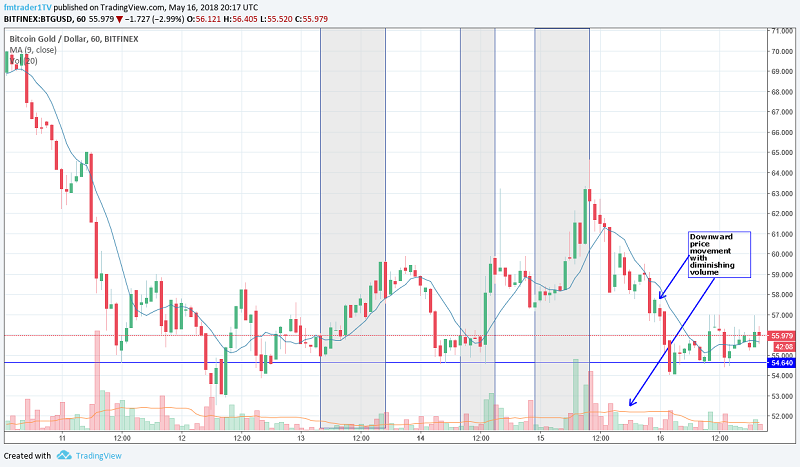
Above is the 60-minute chart for Bitcoin Gold. Some noteworthy observations on this chart are the support level at $54.64 (displayed by the blue horizontal line). The support level has been tested several times but has not been broken. Bitcoin is currently showing a similar pattern support (Can be seen on the daily chart).
Also, volume patterns on Bitcoin Gold are beginning to favor upside potential as indicated by the grey shaded areas which show volume spikes when price makes an upward move, and a diminishing of volume when price made its most recent downward move (As noted in the above chart).
Another notable observation seen on the Bitcoin daily chart price action, each significant price swing is making a lower-high, or a higher-low since bouncing of the low of $6000 on February 6, 2018, which we all know was the bottom of the so-called “Bitcoin Bubble Burst.”
Suggested Articles
- The Week Ahead – Geopolitics and the Fed in Focus
- Bitcoin’s Lightning Network: How Can it Solve Bitcoin’s Biggest Problem
This is forming an asymmetric triangle price pattern. A breakout from this price pattern will eventually result. At present, price action is indicating a breakout to the upside. Bitcoin Gold is definitely priced to better take advantage of the upcoming breakout, whichever direction it may be.
This article was written by Global Coin Report.
About the Author
Did you find this article useful?
Latest news and analysis


Advertisement