


Talking Points:
- The US Dollar pullback has continued into a second day after USD found resistance at the 94-handle shortly after this week’s open. This week’s economic calendar is light on USD-items, and this produces a backdrop where the Dollar can cut in either direction. We look at both sides of the argument below, plotting approaches and investigating potential setups in EUR/USD, GBP/USD, USD/JPY and NZD/USD.
- Tomorrow brings UK inflation numbers for the month of April, and this has become a big push-point for the British Pound. Expect volatility to continue in Sterling, as Friday brings another piece of important data with the release of Q1 GDP numbers out of the UK.
- DailyFX Forecasts have been updated for Q2, and are available from the DailyFX Trading Guides page. If you’re looking to improve your trading approach, check out Traits of Successful Traders. And if you’re looking for an introductory primer to the Forex market, check out our New to FX Guide.
Do you want to see how retail traders are currently trading the US Dollar? Check out our IG Client Sentiment Indicator.
US Dollar Pullback Produces Setups on Both Sides of USD
The US Dollar is continuing to pull back after having run-in to resistance at the 94-handle on DXY yesterday morning. After a quick test of support around the week-open gap, sellers came back to punch prices down to the ‘s2’ zone of support that we were looking at. This comes in at an interesting level, as 93.35 is a swing-high from August of last year that’s continued to show intra-day support/resistance. This level helped to mark an evening star formation on the daily chart two weeks ago, and that was part of the deepest retracement we’ve seen in this move of USD-strength that’s shown rather vividly over the past month. Bulls quickly came back after that retracement to punch USD up to fresh highs last week; but as we’ve opened this week, that same strength simply hasn’t yet shown.
This produces setups on both sides of the Greenback. The bullish side of USD would be looking at this move of weakness as a pullback in the month-long move of strength; while the bearish side of the coin can come from either shorter-term momentum, or longer term continuation of the ‘bigger picture’ bearish trend in the US Dollar that got started in January of last year. In this article, we’ll look at both sides of the argument through a number of different USD major pairs.
US Dollar via ‘DXY’ Two-Hour Chart: Bulls Grasping for Support Around Familiar 93.35
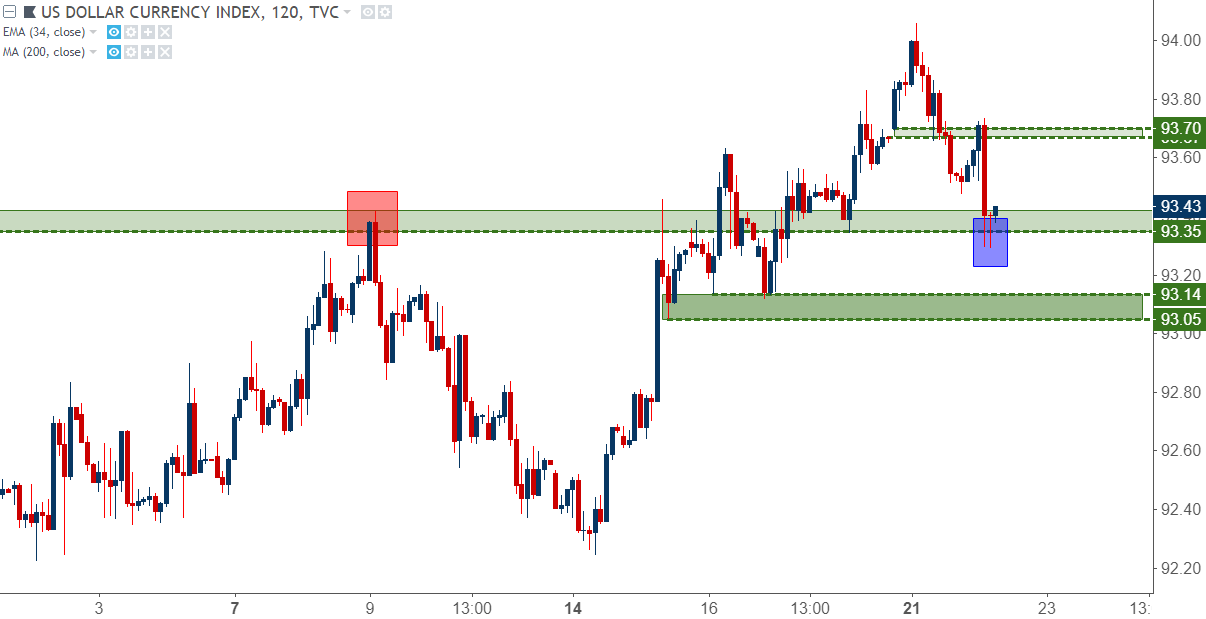
Chart prepared by James Stanley
The Longer-Term View of USD
The down-trend in the US Dollar that started in the beginning of 2017 was persistent, and there was but one two-month period of pause in that trend as sellers remained in-control well-into 2018. But over the past month, that persistent weakness has turned-into persistent strength, and already many have forgotten about what drove USD down to these multi-year lows.
What’s changed here? Sure, US inflation has been a bit more consistent, but the rally in the Dollar doesn’t really mesh with US inflation data. March inflation numbers were released in April, about one week ahead of the start of the topside push. What does sync a bit better with that run of strength in USD is UK inflation, which was released right around the time that USD-bulls started to take-control. A week after that, we had an ECB rate decision where the bank was even more dovish than usual, supported by their own falling rates of inflation. Deductively – weakness in both GBP and EUR allowed for USD-strength to show prominently, and then USD bulls have been able to retain control through the month of May. But – this would still have the quality of a corrective move in the longer-term trend.
On the weekly chart below, we’re focusing-in on price action behind the longer-term move behind the US Dollar, with blue boxes around each of the retracement periods. The move in September of last year ran for approximately two months, and this started from the 50% retracement of the 2014-2017 major move. The more recent topside run has now been going for a month, and this started off of the 61.8% Fibonacci retracement of that same major move. This would put emphasis on the level around 94.30, as this is the 38.2% retracement around the same level that had previously helped to hold support in USD in 2015 and 2016.
That level of 94.30 also happens to be the 38.2% retracement of the more recent bearish trend.
US Dollar Weekly Chart: Approaching Confluence of Potential Resistance 94.30
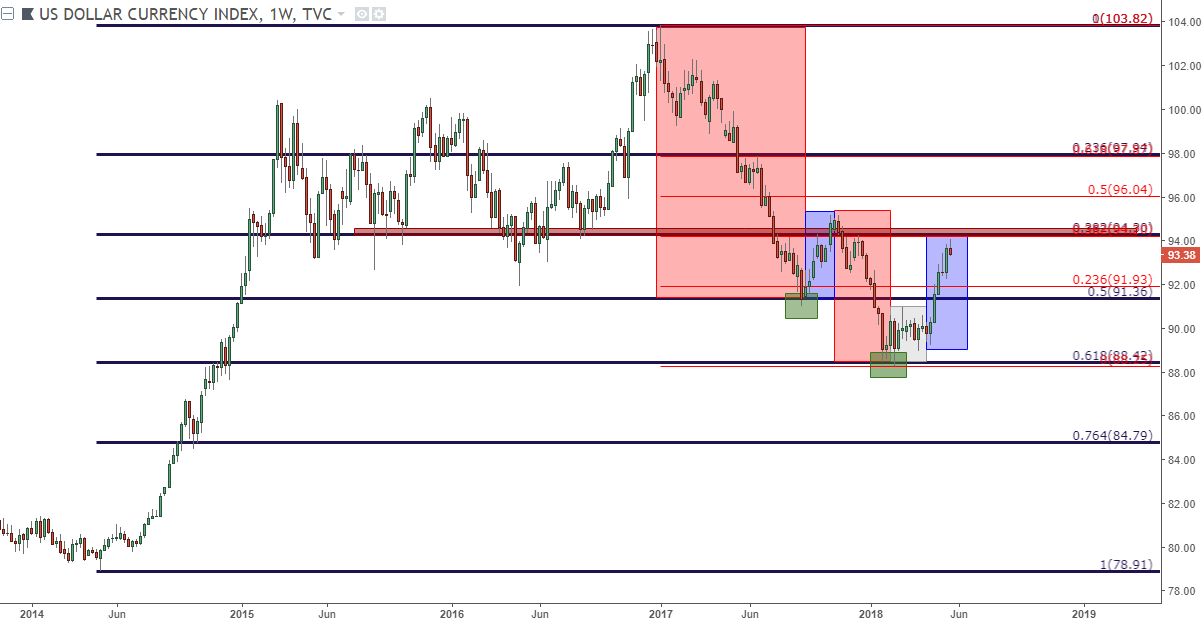
Chart prepared by James Stanley
EUR/USD Bounces From Long-Term Support
Helping that pullback in USD has been a lift in what had become an aggressive down-trend in EUR/USD. After the ECB rate decision in latter-April, bears took control, and pretty much remained in the driver seat into last week. That helped to produce a quick retracement up to the 1.2000 psychological level, at which point sellers came back for more. This drove prices down to a key zone of longer-term support that had showed some relevance in the second half of last year; and so far that support has held as prices continue to move-higher.
EUR/USD Daily Chart: Familiar Support Zone Comes Back into Play
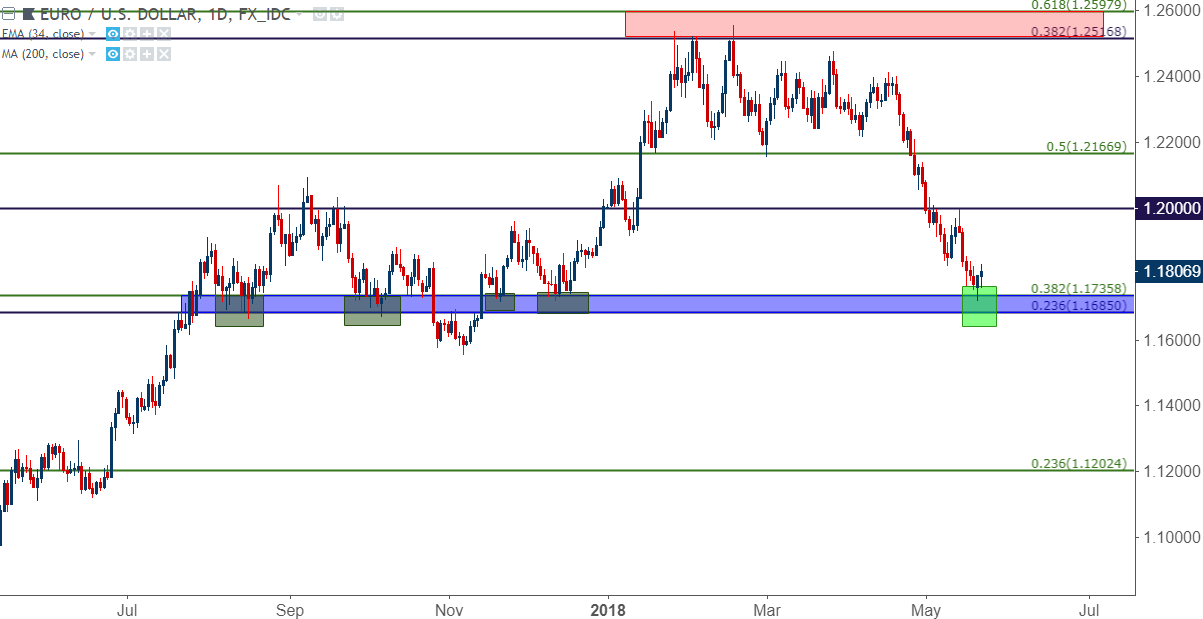
Chart prepared by James Stanley
On the hourly chart, we can see where buyers have started to push a bit harder since that support hit from yesterday, and we now have shorter-term higher-highs and higher-lows to work with. This can open the door to topside setups, looking for a deeper move of strength after a really aggressive sell-off.
EUR/USD Hourly Chart: Buyers Break the Chain, Help to Produce Short-Term Higher-Highs, Lows
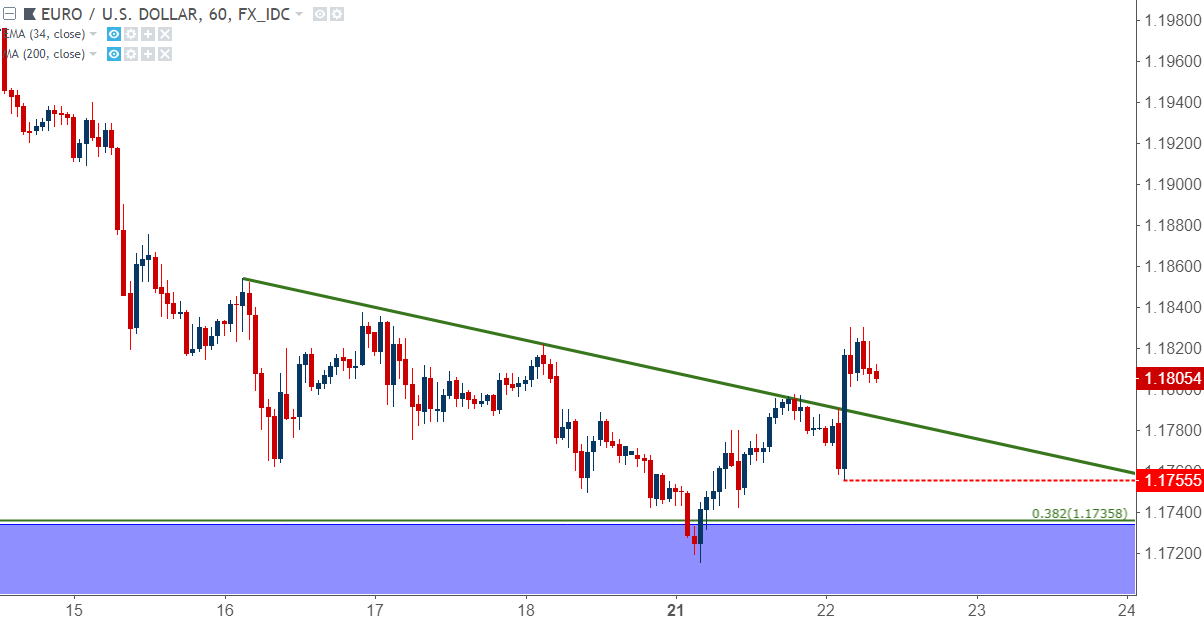
Chart prepared by James Stanley
GBP/USD Tests Lower-High Resistance at Prior Support
GBP/USD on the other hand, continues to carry short-side potential. The voluminous drop in the pair since mid-April is hard to ignore, and this has been driven by a number of factors. While we came into March and even April with the expectation of a rate hike in May, the backdrop for that move really deteriorated and when we did finally get to the rate decision – the BoE had the flexibility to go really dovish, helping to push GBP/USD right back down. This bearish trend didn’t start with the BoE, though, it started around the release of UK inflation numbers for the month of March, which were delivered in mid-April. As mentioned earlier, this syncs up fairly well with the start of the bullish run in USD, and for strategies looking at a continuation of Dollar-strength, GBP/USD will likely remain as one of the more attractive candidates.
We looked at a short-side setup in our article yesterday entitled, GBP/USD: Pound Plummets to 2018 Low Ahead of Big Week of Data. The backdrop for the setup was simply looking for lower-high resistance to show around prior support, and for that we were focusing on a zone that runs from 1.3478-1.3500. That zone came into play earlier this morning, and sellers responded. We’ve seen a bit of support show at 1.3450.
Tomorrow brings UK inflation numbers for the month of April, and Friday brings Q1 GDP numbers to the table. So, we’re likely in for some continued volatility in GBP-pairs.
GBP/USD Hourly Chart: Lower-High Resistance Potential Around Prior Support Zone

Chart prepared by James Stanley
USD/JPY with Bullish Continuation Potential
Last week produced a pronounced bullish run in USD/JPY. After twice resisting at the 110.00 psychological level, prices had pulled back to a key area of potential support. We looked at this as one of our FX setups for last week, and prices quickly ran through two of the three possible targets, coming a mere 10 pips away from the final target of 111.50.
We looked into the pair yesterday with prices posing a 14.4% pullback in this recent bullish move. We advised that patience could be the more operative path, instead focusing on a deeper area of potential support from 110.50 up to 110.74. This would enable stops to be placed below the big figure of 110.00 while looking for the pair to move towards fresh highs.
USD/JPY Four-Hour Chart
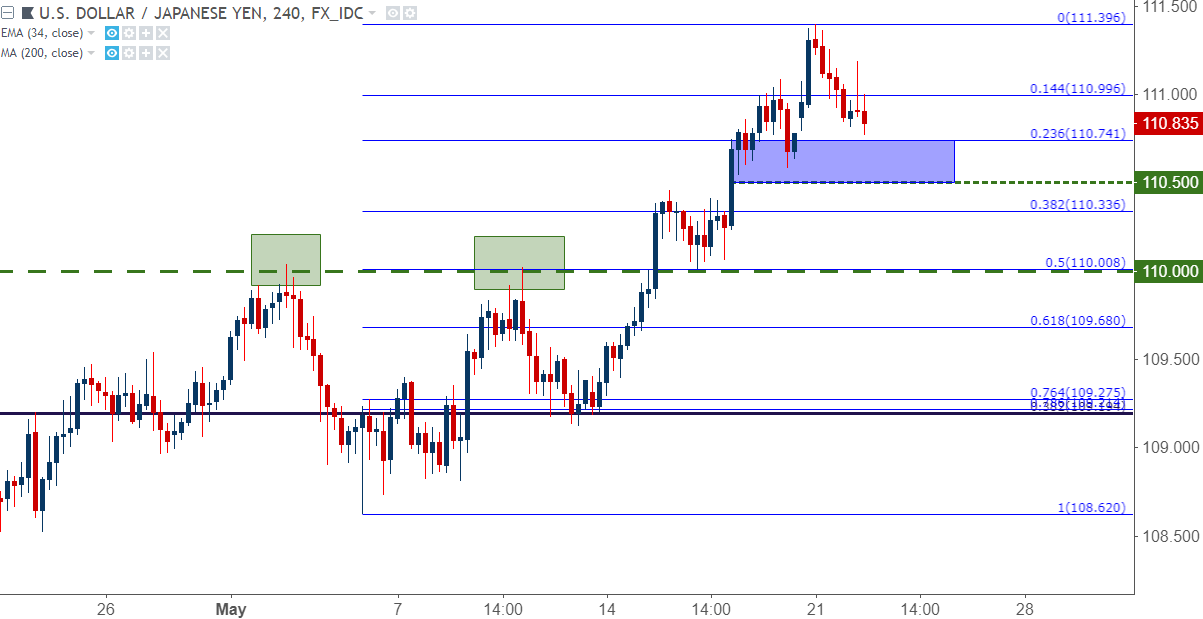
Chart prepared by James Stanley
NZD/USD Tests Support from Two-Year Range
NZD/USD has been working within a range formation for the past two years. We looked at the pair in mid-April as one of the favored ways to look for USD-strength, largely on the basis of that range formation; and prices have quickly broken-down to the support side of that setup over the past month.
Last week prices tested the top-end of the support side of the range at .6870, and so far this week, we’ve seen that support hold. This can keep the door open to bullish NZD/USD setups as a way to get short the US Dollar, looking for some element of fill in this longer-term range formation.
NZD/USD Weekly Chart: Prices Drop into Range Support After Aggressively-Bearish Five-Week Run

Chart prepared by James Stanley
To read more:
Are you looking for longer-term analysis on the U.S. Dollar? Our DailyFX Forecasts for Q1 have a section for each major currency, and we also offer a plethora of resources on USD-pairs such as EUR/USD, GBP/USD, USD/JPY, AUD/USD. Traders can also stay up with near-term positioning via our IG Client Sentiment Indicator.
Forex Trading Resources
DailyFX offers a plethora of tools, indicators and resources to help traders. For those looking for trading ideas, our IG Client Sentiment shows the positioning of retail traders with actual live trades and positions. Our trading guides bring our DailyFX Quarterly Forecasts and our Top Trading Opportunities; and our real-time news feed has intra-day interactions from the DailyFX team. And if you’re looking for real-time analysis, our DailyFX Webinars offer numerous sessions each week in which you can see how and why we’re looking at what we’re looking at.
If you’re looking for educational information, our New to FX guide is there to help new(er) traders while our Traits of Successful Traders research is built to help sharpen the skill set by focusing on risk and trade management.
--- Written by James Stanley, Strategist for DailyFX.com
Contact and follow James on Twitter: @JStanleyFX


