
TALKING POINTS
- Though it’s only down around 3.5 percent over the period, the Dow has dropped 8 days – the worst slide since February 1984
- The BoE and Brexit vote have freed up the Pound, SNB and NZ GDP offered little spark, a Mexican rate hike earns a USDMXN break
- In an active final session for the trading week, EURUSD should be monitored closely as the EU tariffs tap a growing trade war
See how retail traders are positioning in EUR/USD, other key Dollar pairs and global equity indices as monetary policy adds to concern already stoked by trade wars, monetary policy and other critical themes. Find speculative positioning on the DailyFX sentiment page.
Trade Wars and Other Risks are Swaying the Markets
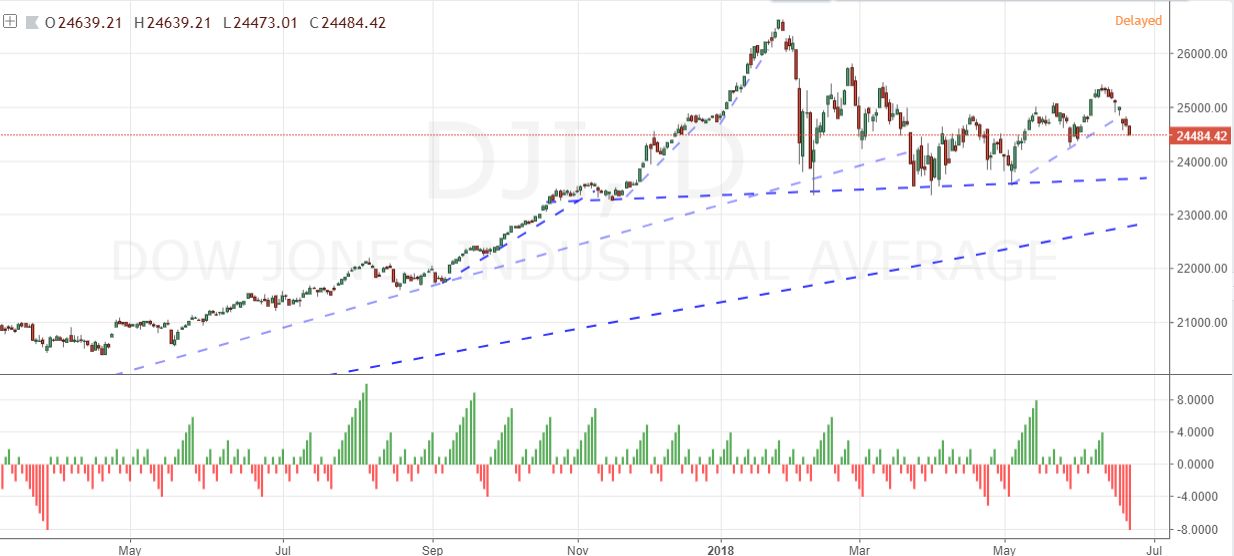
We have yet to experience a systemic unwinding of excessive risk despite the prominence of fundamental concerns surrounding trade wars, monetary policy course reversal and fading growth among other issues. That said, finding conviction in complacency - a default setting in the speculative rank over previous years - would be extremely risky. Not certain doom, but certainly inviting it. Where there has been a lack of intensity in full-scale risk aversion, there has been considerable breadth in the theme. Once again this past session, we registered retreat in a wide course of risk-oriented assets from global equities to emerging markets to carry trades. Correlation in a particular theme like speculative uncertainty is a sign that it exerting considerable influence and merely awaits a spark to catalyze an otherwise dormant risk into a financial fire. The Dow represents this situation well. The benchmark US equity index has not lost much ground over the past few weeks, though its gradual turn is hard to miss on a chart. Suggesting a serious influence though, it has also clocked 8 consecutive trading sessions of loss on a close-over-close basis. There are approximately 10 other instances of a run this long until we get back to February 1984 when we last saw a series of declines longer than this.
Dow Jones Industrial Daily Chart
Trade Wars are Too Hefty to Lose Sight Of
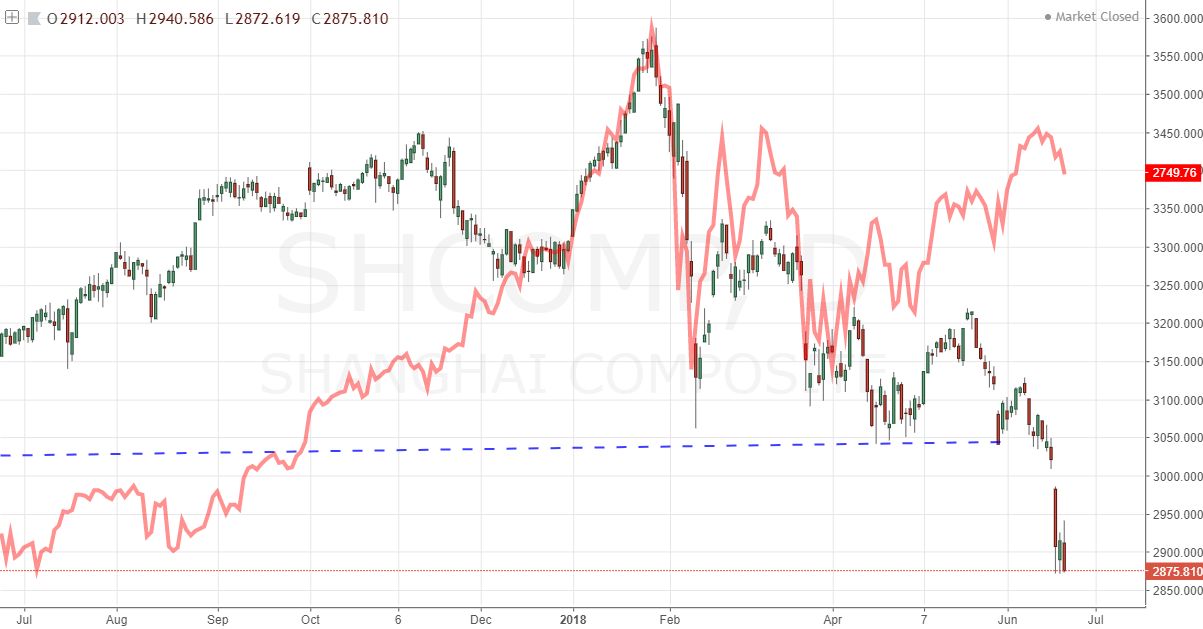
Given the financial fears that have evolved out of the growing trade war these past months, it is rather clear that theme will hover over the market as a dormant but overwhelming influence when once again provoked. The offensive between the US and China has not found any resolution since the latest trade of $50 billion in tariffs between the two and US President Trump's subsequent threat of initiating another $200 billion duties to escalate the tab to extreme levels. It was reported that negotiation teams have found no meaningful ground towards resolution or even de-escalation as of this past session, but US representatives are weighing coming back to the table over the next few weeks. The course of the relationship crash between the US and China is troubling; but if it is from a playbook the President Trump intends to consult regularly, we should be much more cautious. Friday, the European Union's own retaliatory import taxes on select US goods are due to come into effect. A US response through threat of another massive escalation would put in jeopardy trade between the two largest economies in the world - not to mention the bulwarks of the developed world. Where the relationship with China has caveats and can carry rationalized - though indulgent - optimism, speculation wouldn't so readily abide a US-EU fight.
SHCOMP Daily Chart
Avoid the Abstract and Discrete Risks in EURUSD Before Week's End
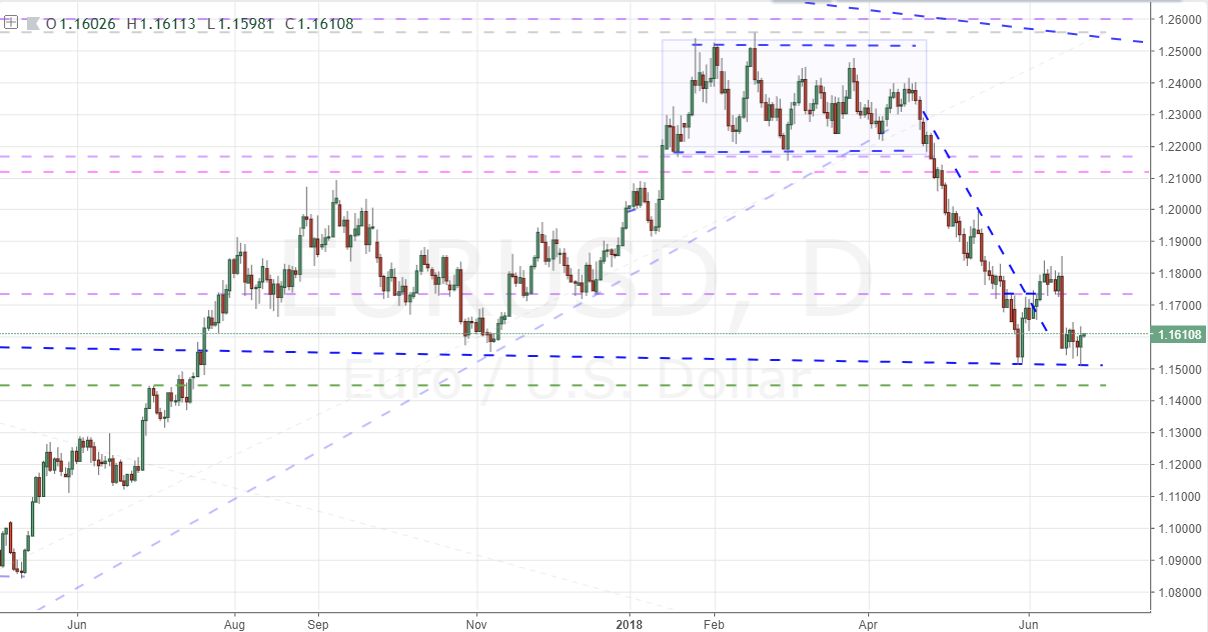
In general, I do not like considering entering trades on a Friday. The twilight liquidity drain into the weekend amid such volatile fundamental themes is inviting high risk of being caught wrong footed in a fast moving market. That said, there are shades of grey especially where risk tolerances differ. As for EURUSD, it is simply too risky in my book to even consider before the weekend. It's technical potential has been deflated after the Dollar bounce these past few months and there is the potential spread of trade wars to this pair specifically as discussed before. Then there is also the event risk on tap. Both the US and Euro-area are due to release the first update of June PMIs from Markit which are good (and timely) proxies for broad GDP readings. Further from the Euro's fundamental backdrop, we have the second day of the Eurogroup's EcoFin meeting and potentially more insight form the IMF which voiced concern over the region this past session.
EUR/USD Daily Chart
On a Sliding Scale of Risk Tolerance
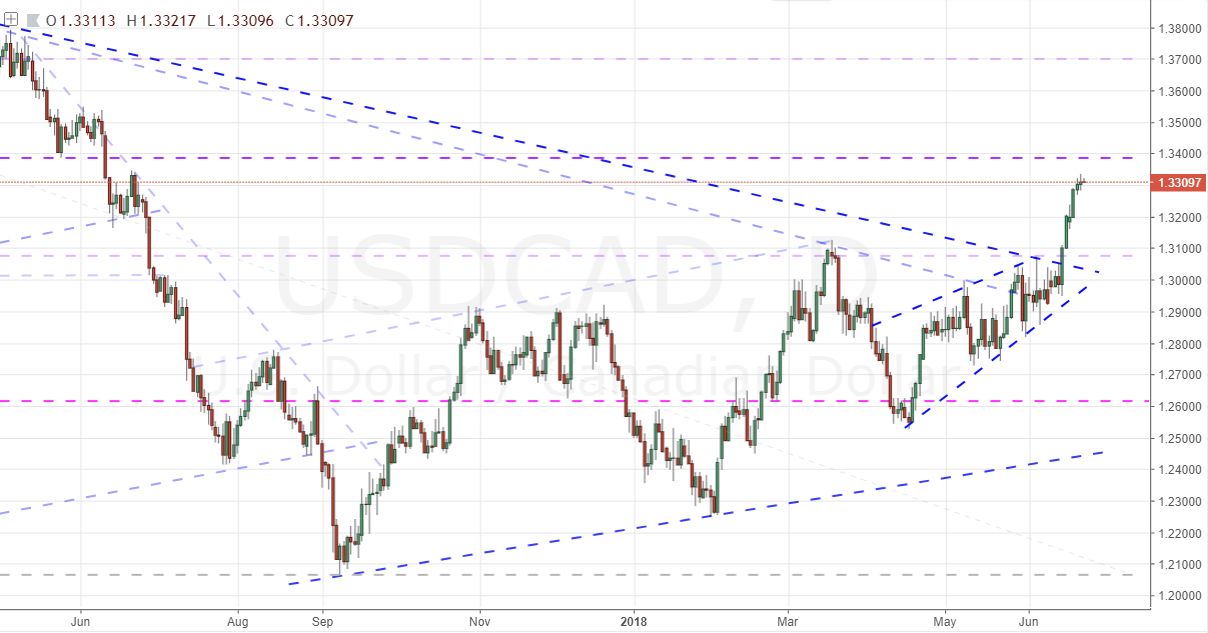
For those that are more comfortable taking risk or have a better strategy for navigating it (such as trading very short-term), there are other markets of interest through this final trading day of the week. Over the past 48 hours, we have seen the Bank of England deliver a hold on policy (6-3) and the Government and Parliament found compromise on the progress of the Brexit bill. That doesn't resolve much, but it does unburden the Sterling if it wants to make a technical or speculative move. The Kiwi dollar similar had its shackles lifted after the release of generally inline 1Q GDP data. The update has caused some technical issues for NZDUSD, but a less conflicted cross is perhaps better. Targeted event risk is still on tap for the Canadian Dollar through Friday. The retail sales stats are noteworthy, but it is the CPI update amid high level BoC rate forecasts that has the real potential. A substantial decline has unfolded for the currency from USDCAD to CADJPY. A strong showing can spur a potential reversal. Less data-centric, gold and oil will have their own winds to follow. The precious metal has slid despite the trouble in trade wars, so be wary of intent. For crude, the OPEC meeting has been built up by plenty of individual member chatter and a restrictive trading range. We discuss all of this and more in today's Trading Video.
USD/CAD Daily Chart
FX TRADING RESOURCES
- Just getting started? See our beginners’ guide for FX traders
- Having trouble with your strategy? Here’s the #1 mistake that traders make
- Join a free Q&A webinar and have your trading questions answered
--- Written by John Kicklighter, Chief Currency Strategist for DailyFX.com
To contact John, use the comments section below or @johnkicklighter on Twitter