
Fundamental Forecast for Gold: Neutral
- Gold prices remain under pressure despite growing concerns of a looming trade war
- What’s driving gold prices? Review DailyFX’s 2018 Gold Projections
- Join Michael for Live Weekly Strategy Webinars on Monday’s at 12:30GMT to discuss this setup and more!
Gold prices are down for the second consecutive week with the precious metal off more than 0.70% to trade at 1269 ahead of the New York close on Friday. The decline comes alongside losses in global equity markets this week as mounting geo-political tensions regarding a looming trade war continue to weigh on risk appetite. Interestingly, gold has not served as ‘safe haven’ for traders with prices still under pressure after last week’s outside weekly reversal.
Tariffs Stoke Trade War Concerns
The intensification of rhetoric between China and the U.S. has continued to weigh on market sentiment as investors weigh the impact of an all-out trade war between the world’s largest economies. While these concerns would typically be supportive for the yellow metal, expectations for higher rates and persistent strength in the US Dollar have kept prices under pressure with gold breaking to fresh yearly lows this week.
Things have been quiet on the data front but look for that to change next week with U.S. Durable Goods Orders and the third and final read on 1Q GDP on tap. Highlighting the economic docket will be the May read on Core PCE (personal consumption expenditure) on Friday. Consensus estimates are calling for an uptick in the Fed’s preferred inflationary gauge to 1.9% y/y. A strong print here would likely see traders continue to price in a fourth rate-hike from the central bank this year- a scenario that would weigh on gold prices.
As it stands, expectations are for a 25bps hike in September with December Fed Fund Futures hovering just under 50%. That said, there’s room for adjustment and strong US data will continue to fuel these expectations. Keep in mind that the central bank will now be holding press conferences at each policy meeting and offers committee members more flexibility with respect to the timing of subsequent hikes. For gold, the focus is on technical support just lower and while prices may see a near-term reprieve next week- the broader risk remains weighted to the downside… for now.
New to Trading? Get started with this Free Beginners Guide
Spot Gold IG Client Positioning
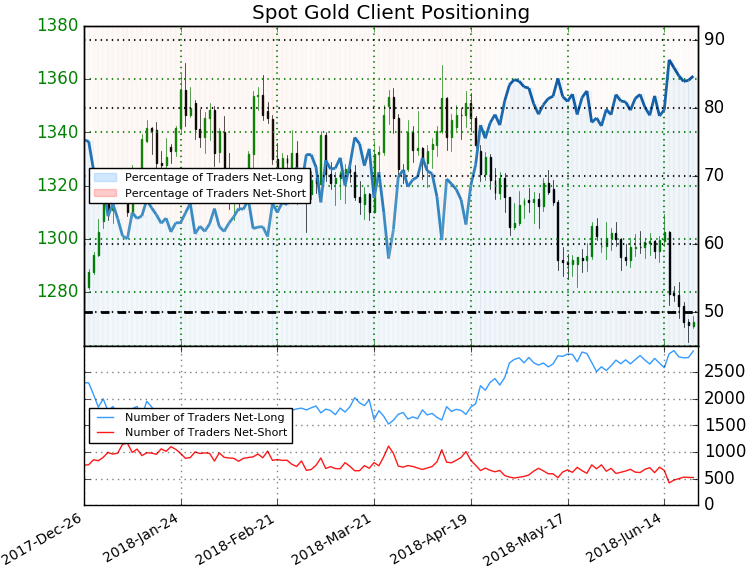
- A summary of IG Client Sentiment shows traders are net-long Gold- the ratio stands at +5.54 (84.7% of traders are long) –bearishreading
- Long positions are 4.7% higher than yesterday and 8.0% higher from last week
- Short positions are 4.4% lower than yesterday and 9.5% lower from last week
- We typically take a contrarian view to crowd sentiment, and the fact traders are net-long suggests Spot Gold prices may continue to fall. Traders are further net-long than yesterday and last week, and the combination of current positioning and recent changes gives us a stronger Gold-bearish contrarian trading bias from a sentiment standpoint.
Review Michael’s educational series on the Foundations of Technical Analysis: Building a Trading Strategy
Gold Weekly Price Chart
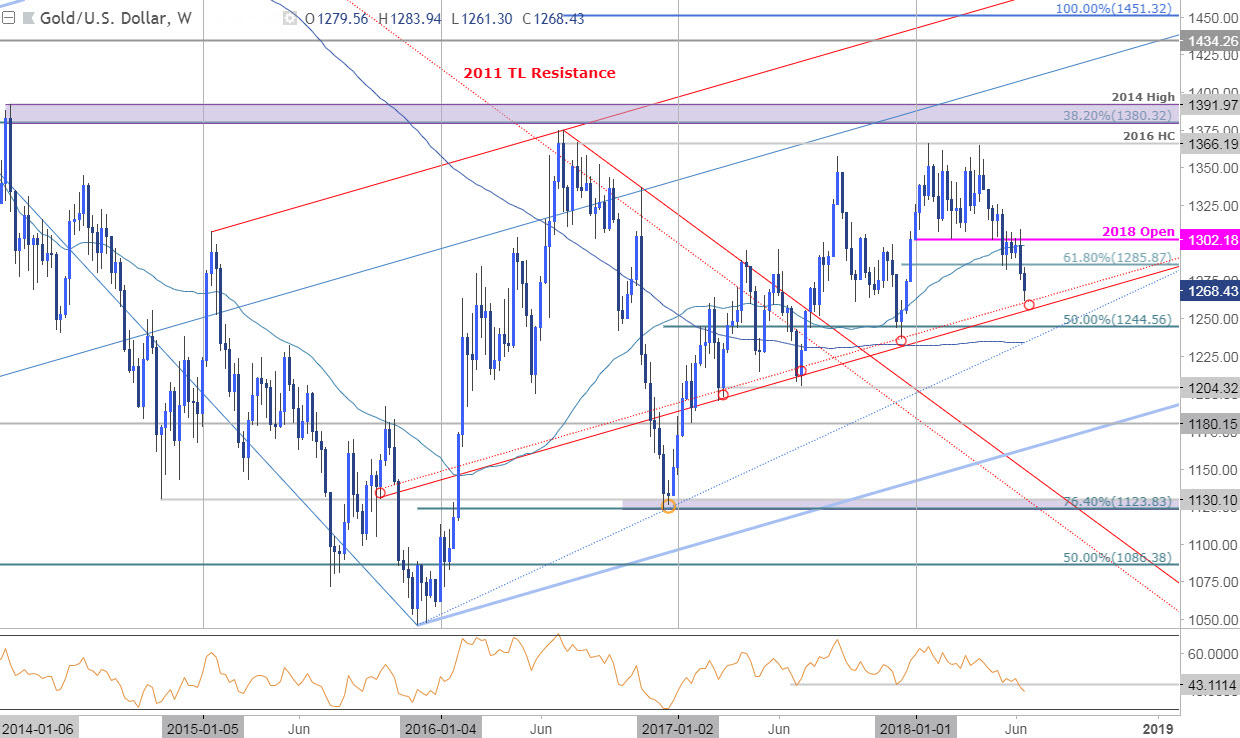
Gold prices posted an outside weekly reversal off resistance off yearly open resistance earlier this month with the subsequent decline now approaching a series of parallels which could offer some near-term support. The region of interest is 1255/60. Keep in mind that weekly momentum has fallen to its lowest levels since January 2017 and further highlights the downside risk for bullion.
A break below this slope targets the 50% retracement of the late 2016 advance at 1245 backed closely by the 200-week moving average / trendline support at ~1235. Weekly resistance stands at 1285 with bearish invalidation steady at the 52-week moving average / 2018 open at 1298/1302.
Bottom line: A break of the June opening range has me looking for a late-month low in price. That said, look for possible recovery next week to offer more favorable short-entries while below the yearly open. For a complete technical breakdown of the near-term Gold price levels (daily & intraday), review this week’s XAU/USD Technical Outlook.
What are the traits of a Successful Trader? Find out with our Free eBook !
---Written by Michael Boutros, Currency Strategist with DailyFX
Follow Michaelon Twitter @MBForex or contact him at mboutros@dailyfx.com