


AUDUSD Analysis and Talking Points
- Australian Dollar set for greater losses on Yuan sell-off
- No Sign of Chinese Intervention Increases Scope of Further AUD Drop
- See our Q3 AUD forecast to learn what will drive the JPY through the quarter.
The Australian Dollar has resumed its sell-off having failed to break above 0.7400, which in turn is now trading around 0.7350. While the surging USD has weighed on the Aussie, a large influence has also been the plunge in the Yuan, whereby USDCNH is now trading at the highest level in a year as concerns over China’s flagging growth increases.
No Sign of Chinese Intervention Increases Scope of Further AUD Drop
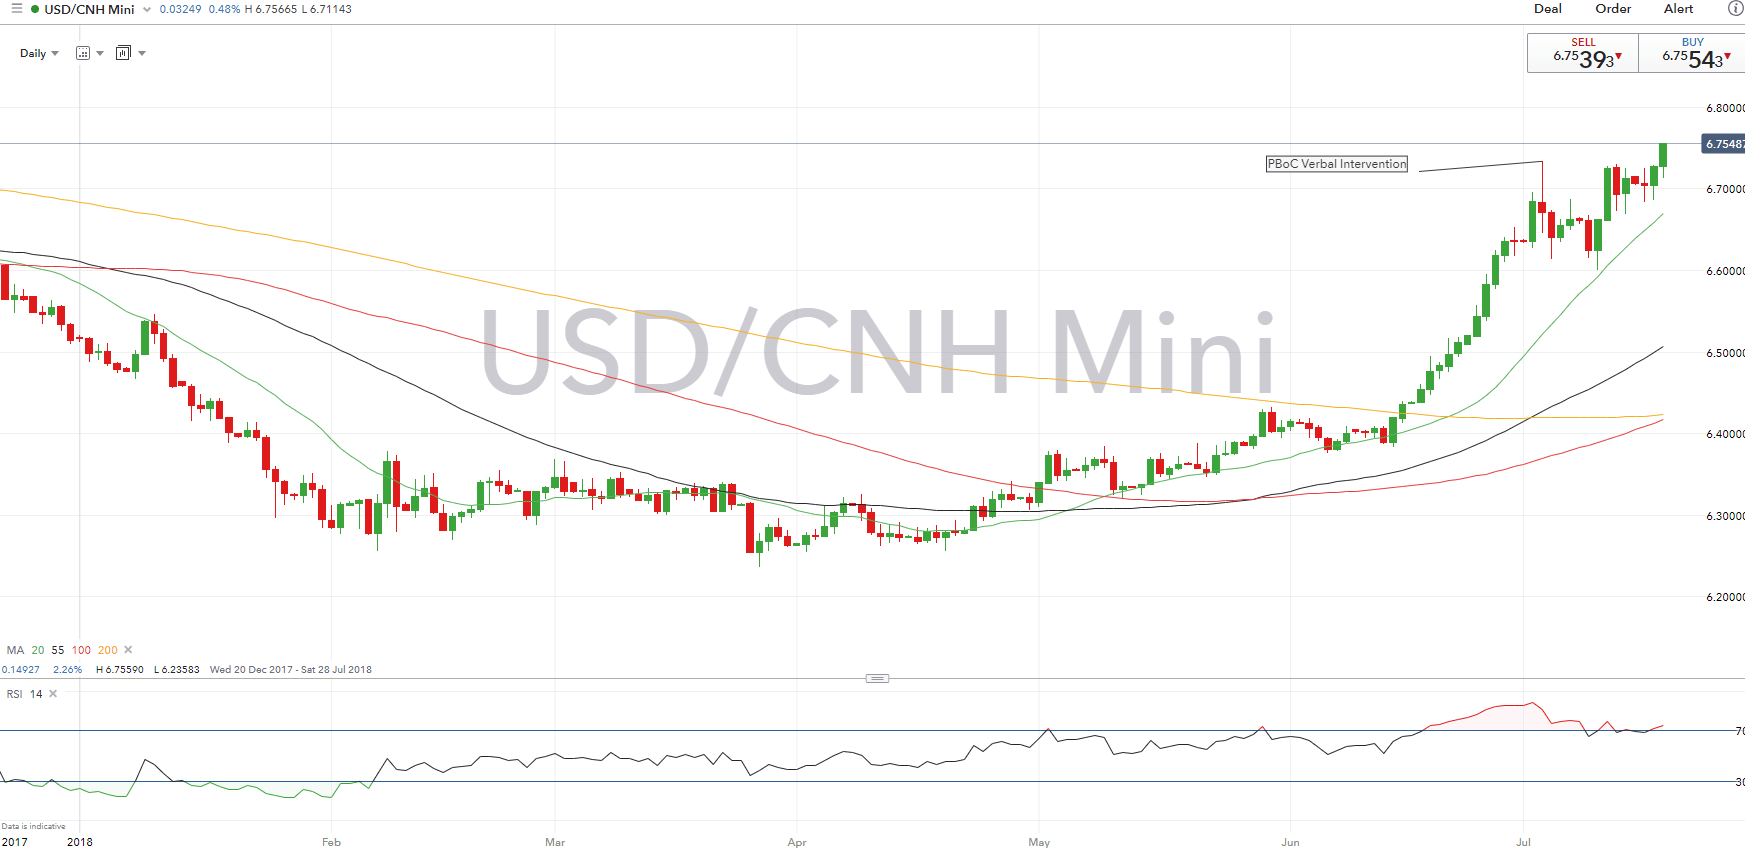
Most notably, USDCNH is now above the level where the PBoC and state banks had intervened and curbed the Yuan selling. Consequently, with no signs of any intervention by Chinese officials, this signals that both the Yuan and Australian Dollar are susceptible to further weakness with the latter typically seen as a liquid proxy to Chinese sentiment.
USDCNH PRICE CHART: Daily Time Frame (December 2017-July 2018)
Australian Dollar Technical Levels
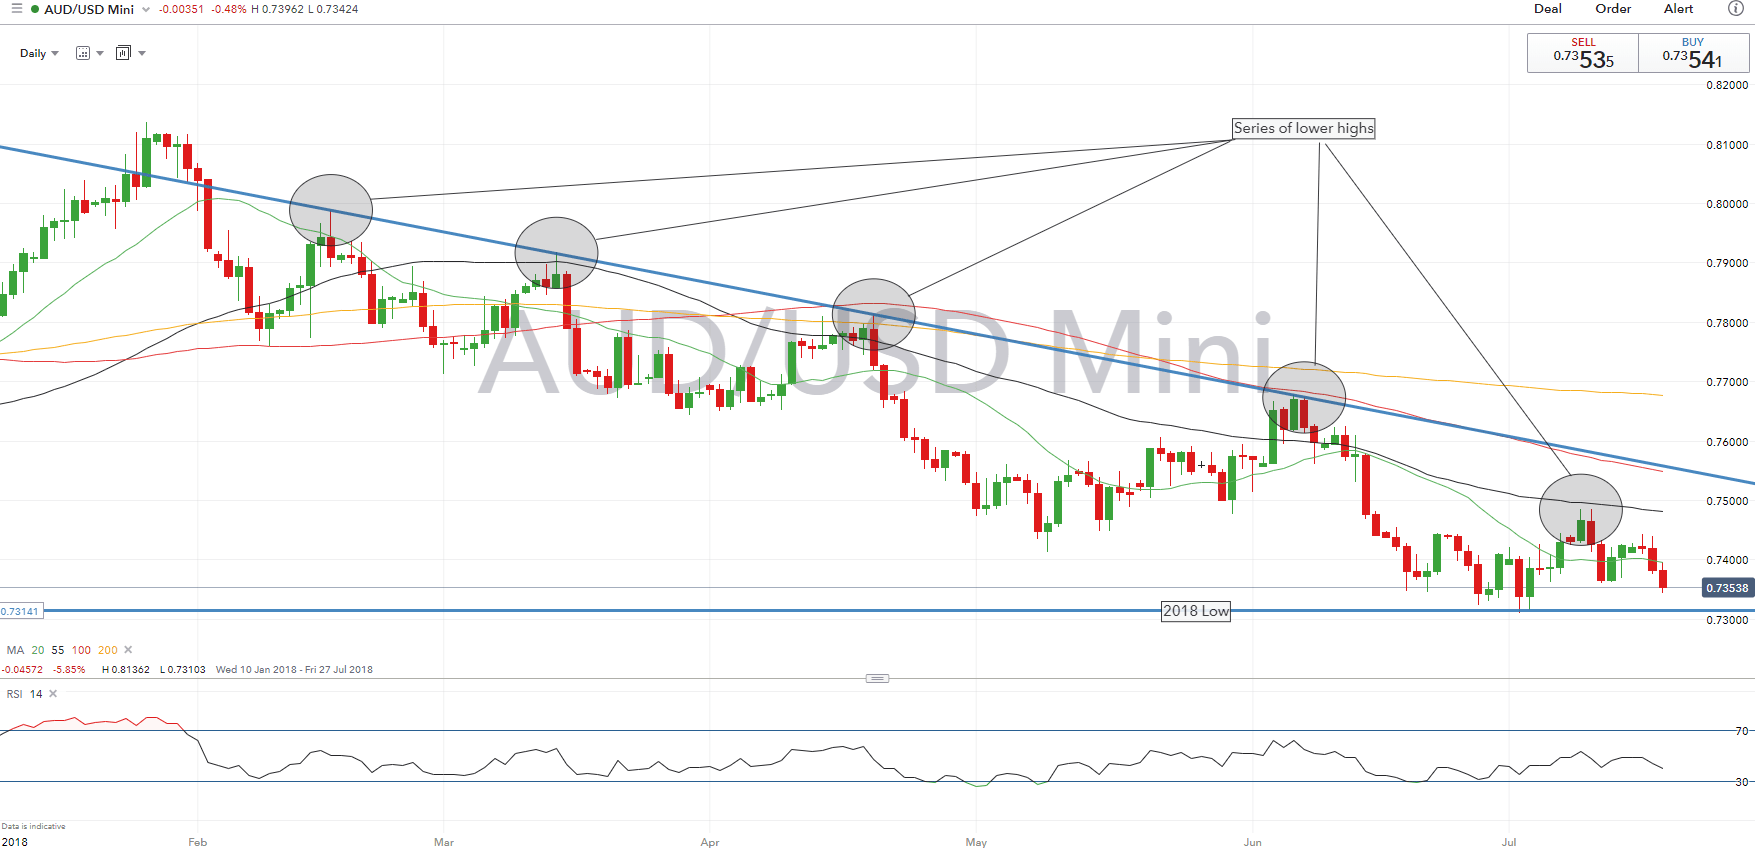
A series of lower highs keeps the bearish trend intact for the pair. 0.7350 is holding for now, however, any bids towards 0.7370-80 provides an opportunity to reload shorts back down towards 0.7300. A firm break below suggests that deeper losses to the mid 0.71 is on the horizon. On the upside, resistance sits at the 20DMA (0.7395), while the high’s seen on Monday at 0.7444 also offers resistance.
AUDUSD PRICE CHART: Daily Time Frame (January 2018-July 2018)
Where Next for AUDUSD?
According to IG Client Positioning combination of current sentiment and recent changes gives us a stronger AUDUSD-bearish contrarian trading bias.
--- Written by Justin McQueen, Market Analyst
To contact Justin, email him at Justin.mcqueen@ig.com
Follow Justin on Twitter @JMcQueenFX


